Economic Indicators
Categories
Global Equities
Multinationals navigate a new reality
 David Polak
May 1, 2025
Don't miss our latest insights.
Signs of the wavering dominance of U.S. equities renewed interest in global equities in early 2025. Now, the market volatility following the April 2nd “Liberation Day” announcement of U.S. tariffs is giving investors even more impetus to take a fresh look at global equity strategies and rethink assumptions embedded in their portfolios. The current disruption is the latest step in a multi-year trend of changing global trading patterns and tariffs. This dislocation presents risks and opportunities for institutional investors and underscores the importance of active management in global equity mandates.
Change brings opportunity for active investors
Our portfolio managers see this moment as ripe with opportunity for thoughtful stock selection.
While new tariffs pose challenges, portfolio managers believe that multinational companies that adapt could gain enduring strategic advantages. Their scale, flexibility and experience in global markets make them more capable of navigating disruptive environments than their single-market competitors.
In this environment, investors need to put individual company and sector positions under the microscope. For example, tariffs were levied quickly on commoditized heavy industries such as metals and autos, weighing on companies in or adjacent to those industries. Conversely, there may be less impact in growth sectors like biopharma and semiconductor equipment, where some companies operate with limited competition. Those that provide essential products to the U.S. — such as patented drugs and specialized semiconductors and semiconductor-making equipment — also may be less affected if their products cannot easily be replaced by U.S. producers.
To be sure, the impact of tariffs could vary substantially, even within the same industry and country of domicile. Certain companies may be more affected by tariffs than others based on the locations of their supply chains and customers.
This new era of tariffs and protectionism could put “multilocal” companies at a strategic advantage. These are multinationals with the resources to respond to local-market consumer preferences and regulatory regimes, even as they enjoy economies of scale, diversified customer bases and global brand recognition. Pharmaceutical companies Novo Nordisk and AstraZeneca, based in Denmark and the U.K., respectively, are good examples. They are expanding research and manufacturing operations in the U.S., which could help reduce their exposure to U.S. tariffs. This highlights the importance of a global approach to equity investing as companies’ domiciles become less important.
Ultimately, we believe that active managers are well positioned to nimbly adjust portfolios to navigate these uncertainties and respond to fast-moving developments in global trade policy.
How our global equity portfolio managers view the opportunity set
For investors assessing the evolving trade picture, the focus may be less on whether U.S. or non-U.S. companies will prevail than on finding the winners and losers in all geographies — an effort requiring fundamental research at the core.
But global trade developments are not the only source of potential opportunities. Equity valuations, for instance, clearly point to opportunities outside the U.S. market. Non-U.S. stocks carry far lower multiples than U.S.-based competitors, offering a broad set of attractively priced equities to then assess through the lens of tariffs.
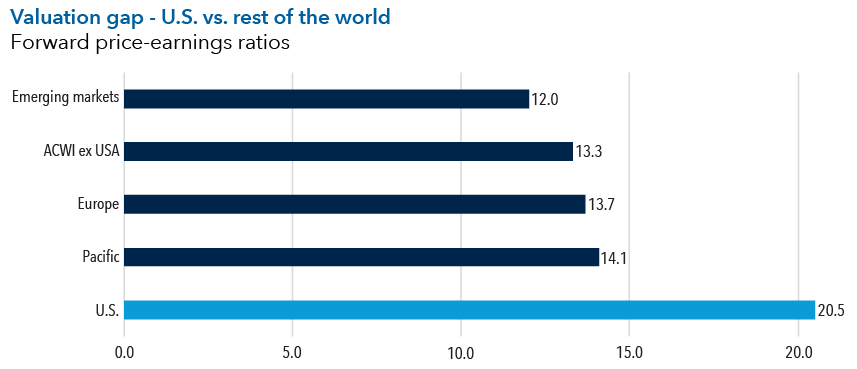
Source: RIMES. As of March 31, 2025. Data reflects price-to-earnings ratios based on future earnings expectations. Calculations are based on the MSCI Emerging Markets Index, MSCI All Country World Index ex USA, MSCI Europe Index, MSCI Pacific Index and MSCI USA Index, respectively.
A potential decline in U.S. market concentration may also create fresh opportunities for investors. The Magnificent 7 stocks that have driven U.S. equity market gains in recent years are the latest in a string of once impregnable market leaders that includes technology stocks in the 1990s, Japanese stocks in the 1980s and the “Nifty Fifty” growth stocks that dominated U.S. markets in the early 1970s.
A pullback in the Magnificent 7 could lead to gains in a broader swath of large-cap companies. As shown below, several dozen companies whose market caps collectively equaled the Magnificent 7’s at year-end 2024 generated significantly higher sales and profits. This highlights another large and diverse opportunity set.
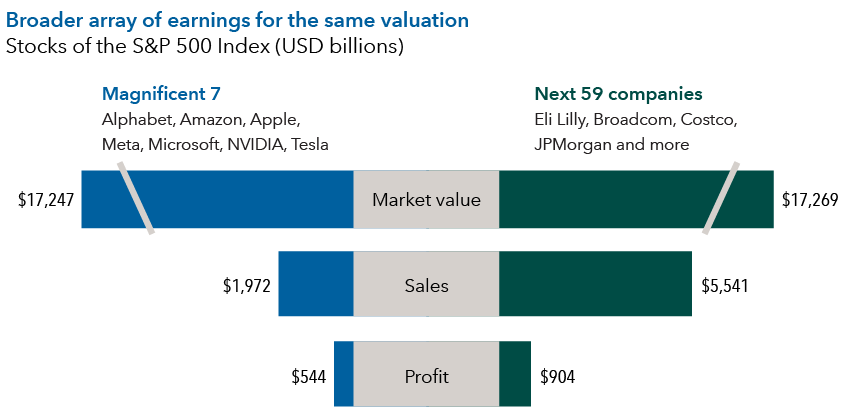
Source: FactSet. As of December 31, 2024. Next 59 stocks are determined based on market capitalization. Sales and profit represent net sales and operating profits, respectively, and are based on corporate reports for the trailing 12 months.
Our global equity team believes earnings growth will support this trend. They expect S&P 500 Index companies outside the Magnificent 7 to narrow the growth gap with the Magnificent 7. This could increase the likelihood that a larger swath of companies will contribute to equity market returns.
Mag 7 earnings growth converging with the rest of the S&P 500
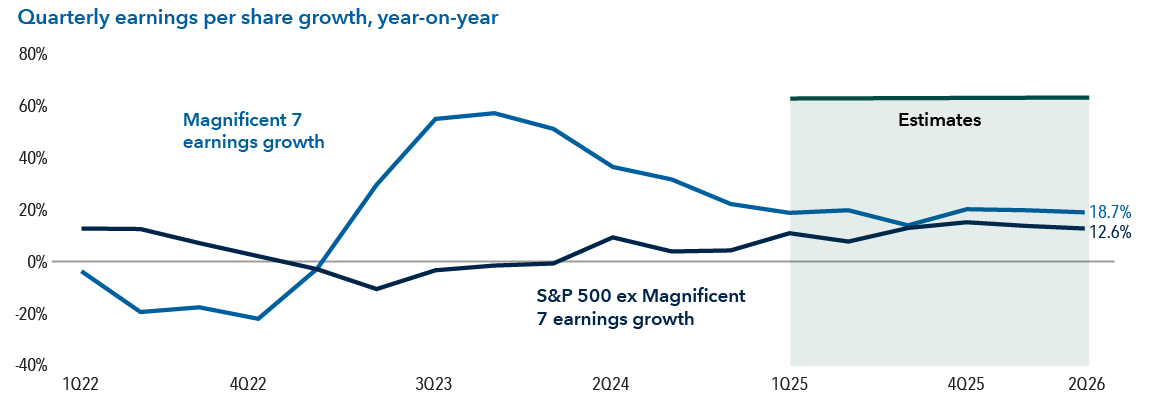
Source: Bloomberg. As of December 31, 2024. Earnings = net income. Magnificent 7 stocks include Alphabet, Amazon, Apple, Meta, Microsoft, NVIDIA and Tesla.
Summary
The new U.S. administration has brought a renewed emphasis on restructuring global trade and other policies intended to rewire the U.S. economy. As these efforts take hold, multinational companies will be challenged to navigate a rapidly changing operating environment. For investors, the key will be to assess the growth prospects of multinationals and their ability to navigate evolving global trade patterns, regardless of their geographies.
Learn more about
S&P 500 Index is a market capitalization-weighted index based on the results of approximately 500 widely held common stocks.
MSCI All Country World (ACWI) ex USA Index is a free float-adjusted, market capitalization-weighted index that measures equity market results in the global developed and emerging markets, excluding the United States.
MSCI Europe Index measures the performance of equity markets in 15 developed countries in Europe.
MSCI Pacific Index is designed to measure the equity market performance of the developed markets in the Pacific region. It consists of Japan, Australia, Hong Kong, New Zealand and Singapore.
MSCI Emerging Markets Index is a free-float-adjusted market-capitalization-weighted index designed to measure equity market results in more than 20 global emerging markets.
MSCI USA Index is designed to measure the performance of the large and mid cap segments of the U.S. market.
MSCI has not approved, reviewed or produced this report, makes no express or implied warranties or representations and is not liable whatsoever for any data in the report. You may not redistribute the MSCI data or use it as a basis for other indices or investment products.
Each S&P Index ("Index") shown is a product of S&P Dow Jones Indices LLC and/or its affiliates and has been licensed for use by Capital Group. Copyright © 2025 S&P Dow Jones Indices LLC, a division of S&P Global, and/or its affiliates. All rights reserved. Redistribution or reproduction in whole or in part is prohibited without written permission of S&P Dow Jones Indices LLC.
Our latest insights
-
-
Market Volatility
-
Asset Allocation
-
World Markets Review
-
Regulation & Legislation
RELATED INSIGHTS
-
Economic Indicators
-
-
Market Volatility
Don’t miss out
Get the Capital Ideas newsletter in your inbox every other week
Investments are not FDIC-insured, nor are they deposits of or guaranteed by a bank or any other entity, so they may lose value.
Investors should carefully consider investment objectives, risks, charges and expenses.
This and other important information is contained in the prospectuses and summary prospectuses, which can be obtained from a financial professional and should be read carefully before investing.
Statements attributed to an individual represent the opinions of that individual as of the date published and do not necessarily reflect the opinions of Capital Group or its affiliates. This information is intended to highlight issues and should not be considered advice, an endorsement or a recommendation.
All Capital Group trademarks mentioned are owned by The Capital Group Companies, Inc., an affiliated company or fund. All other company and product names mentioned are the property of their respective companies.
Use of this website is intended for U.S. residents only.
Capital Client Group, Inc.
This content, developed by Capital Group, home of American Funds, should not be used as a primary basis for investment decisions and is not intended to serve as impartial investment or fiduciary advice.