Economic Indicators
Categories
Bonds
Five factors for long-term investors considering high yield
 Shannon Ward
 David Bradin
July 1, 2025
When building a long-term portfolio, getting it wrong can be costly: As returns compound, so can the regret of missing out on value. High-yield bonds are an example of a sector that some investors may overlook. We believe it warrants their attention.
Since COVID-19 disrupted markets in early 2020, high yield has been one of the best-performing fixed income sectors. In fact, high yield has significantly outpaced the Bloomberg U.S. Aggregate Index, U.S. corporate bonds, emerging markets bonds and securitized credit — and by a wide margin. Looking to history, we believe the high-yield market has the potential to remain strong and could serve many investors well as a permanent portfolio allocation. Here are five factors we believe they should consider when thinking about high yield.
High yield has outpaced most fixed income sectors since 2020
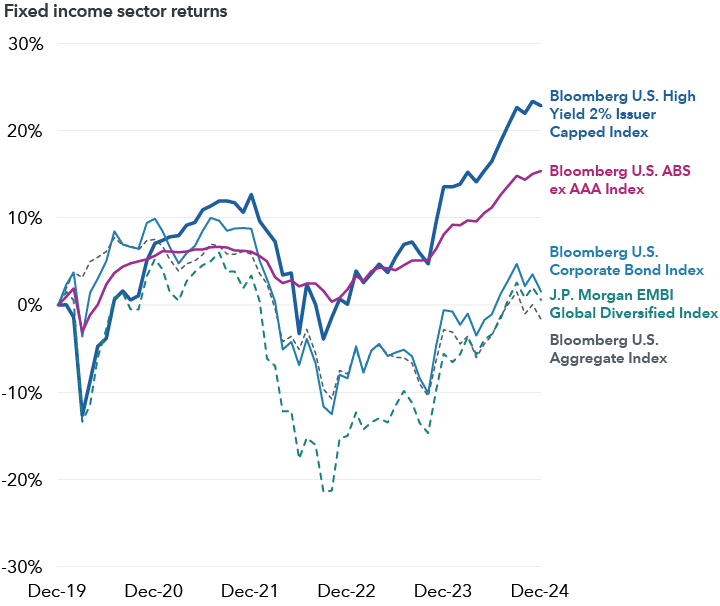
Source: Bloomberg. As of 12/31/24. Past results are not predictive of results in future periods.
1. High yield market timing can be a dangerous game
To be sure, current high-yield spreads (or the premium bondholders earn over Treasuries) are relatively tight. But in our view, investors who are waiting for spreads to widen may be missing the forest for the trees. If we segment the economic cycle into four periods, high-yield spreads look similar across early-, mid- and late-cycle. And within the fourth period, recessions, one extreme outlier — the 2007—2009 Global Financial Crisis (GFC) — accounts for most of the dramatic widening over the past 20 years. During the GFC, spreads on the Bloomberg U.S. High Yield 2% Issuer Capped Index widened to 1,940 basis points (bps) on December 16, 2008 — almost 400% higher than their average of 488 bps since December 2004. But other than that timeframe, spreads have exceeded 1,000 bps only once in the past 20 years: during the COVID-19 pandemic, when they peaked at 1,099 bps on March 3, 2023.
This makes timing the high-yield market a particularly dubious strategy. In order to be successful, market timers would likely need to make several accurate calls over many years in order to beat the high-yield sector’s long-term average return — something like flipping a coin multiple times and needing it to come up heads every time. Instead, we believe investors should be careful not to sacrifice the higher coupon rates and greater income that the sector may provide over the long term.
The same potential market timing mistake applies to portfolio construction. Many investors maintain a core fixed income allocation in an effort to achieve a degree of diversification from equities and to generate moderate income, but they may not include high yield as part of their fixed income strategy. Still, ignoring high yield entirely could limit their portfolio’s long-term return potential.
For example, consider the Bloomberg U.S. Aggregate Index (the Agg) as a proxy for an investor’s core fixed income allocation. Over the past 20 years, the Bloomberg U.S. High Yield 2% Issuer Capped Index has outpaced the Agg by 3.4% on an annualized basis. Looking at periods where high-yield spreads have been below their historical average, the sector has still outpaced the Agg by 1.5% on a forward 12-month basis.
Since 2004, high yield has outpaced core fixed income – even when spreads were tight
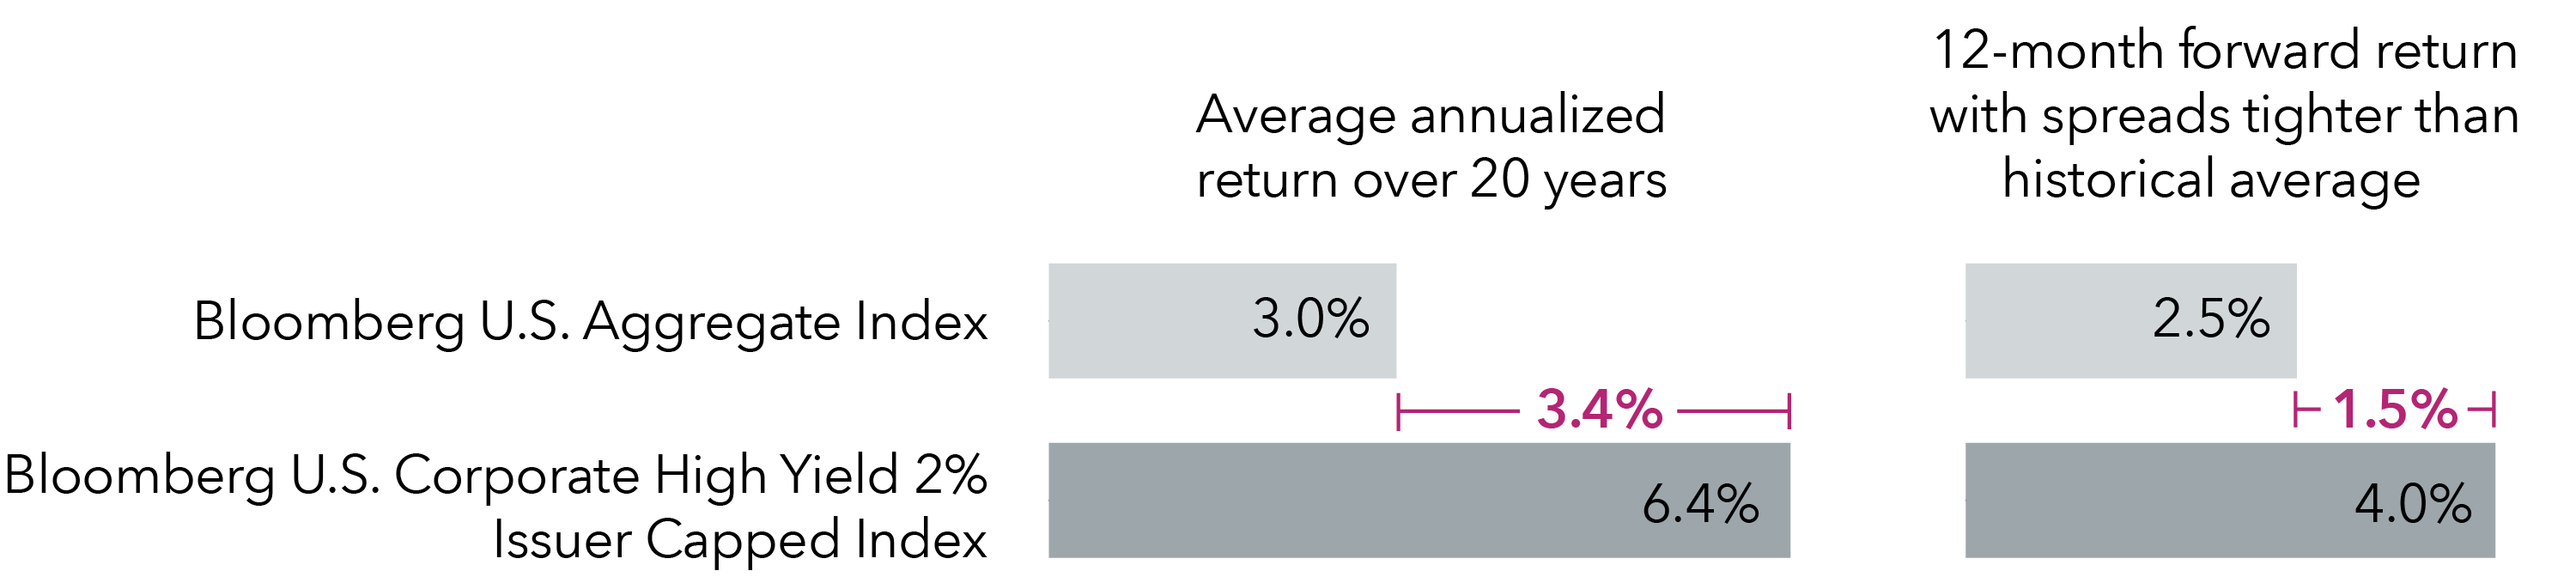
Source: Bloomberg Index Services Limited. As of 12/31/24. Past results are not predictive of results in future periods.
We believe maintaining an allocation to high yield as a complement to a core bond position has the potential to improve fixed income investors’ returns.
2. History provides indications of what has driven returns
Historically, the high-yield sector’s yield to worst (YTW) has been a strong indicator of forward returns. In this case, YTW is defined as the lowest possible yield that a bond portfolio can generate if the underlying issuers fulfill all their payment obligations. With that as a starting point, we can then look at the sector’s yield capture, or the percentage of a fixed income asset's starting yield to worst that is reflected in an investor's return over a specific period of time. Using the Bloomberg U.S. High Yield 2% Issuer Capped Index as a proxy for the high-yield market, over the past one, three, and five years, high-yield investors would have captured between 77.6% to 82.4% of the sector’s YTW at the time of their investment.
YTW can provide an indication of forward returns
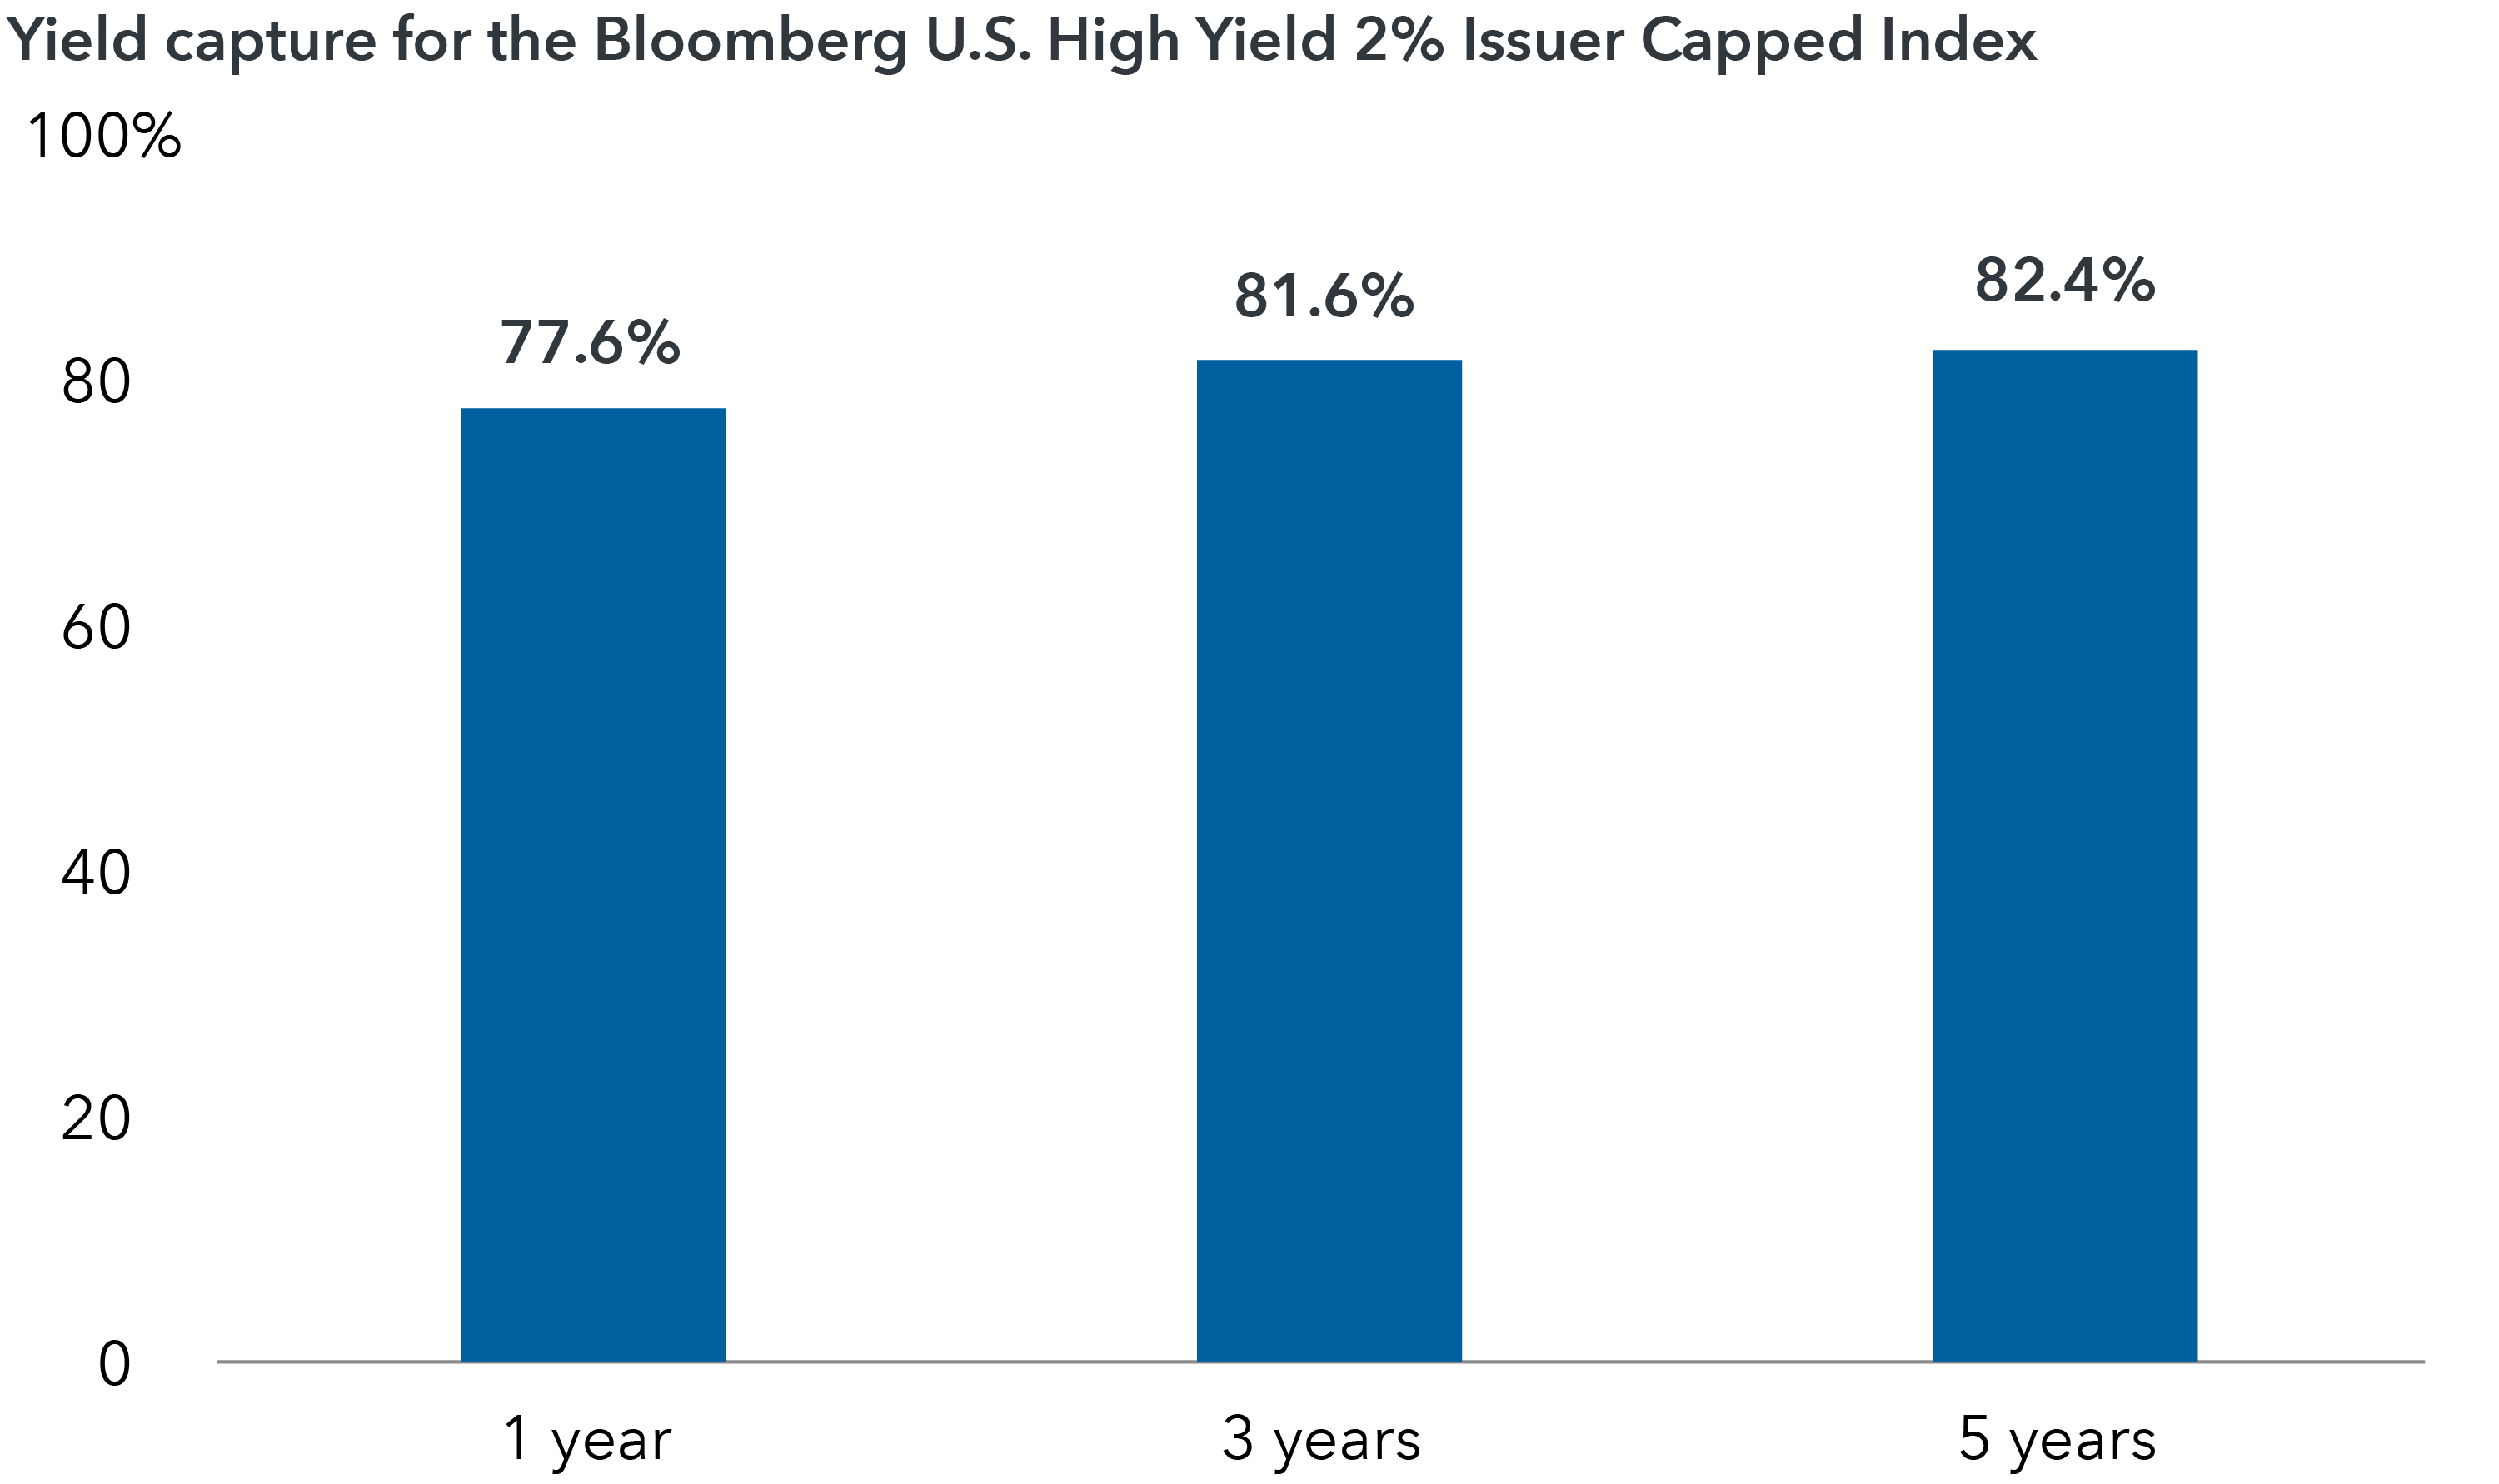
Source: Bloomberg Index Services Limited. As of 12/31/24. Past results are not predictive of results in future periods.
Of course, returns can always deviate from their historical average, but with high yield’s current YTW at almost 7.5% (according to Bloomberg, as of 12/31/24), we believe the sector offers strong long-term return potential despite its current spreads.
3. S&P 500 Index constituent earnings growth: a complementary indicator
High yield’s economic sensitivity means that year-over-year earnings growth among high-yield issuers is typically correlated to earnings growth among the constituents of the broad equity market. Over the past 20 years, year-over-year earnings growth among the constituents of the S&P 500 Index and earnings growth among U.S. high-yield issuers have exhibited a similar pattern: When earnings growth among S&P 500 Index constituents has been positive, earnings growth among U.S. high-yield issuers has tended to be positive as well.
A distinct correlation among earnings
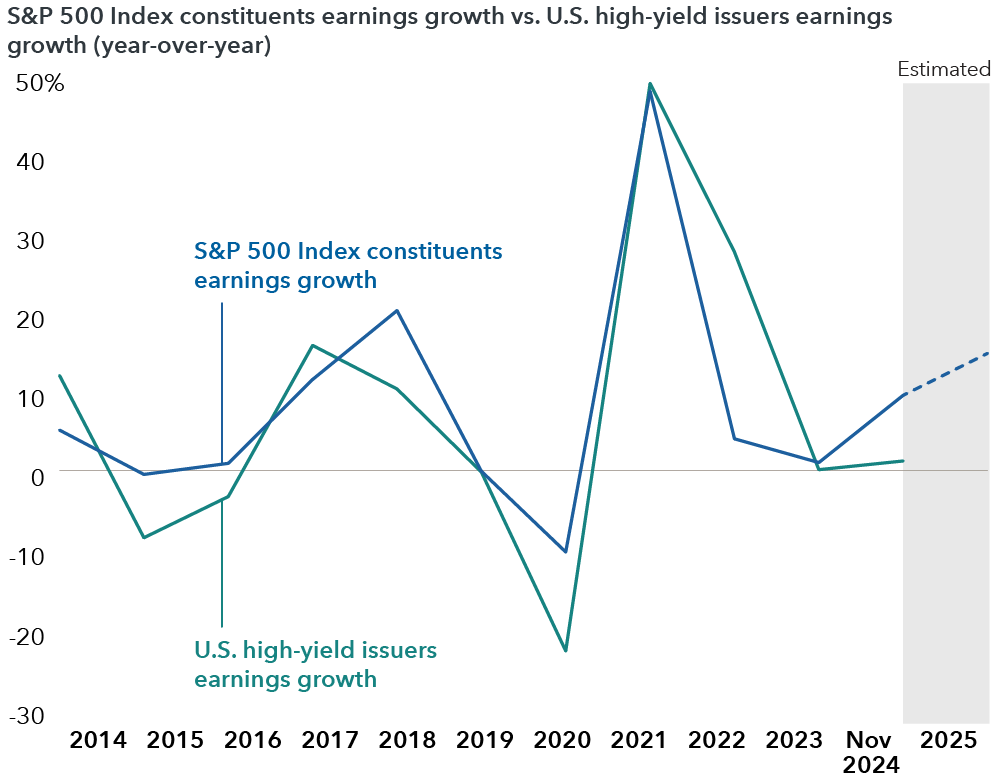
Source: FactSet. As of 11/30/24. U.S. high-yield issuer earnings growth based on Bank of America Merrill Lynch data.
Capital Group economists project that earnings growth among the constituents of the S&P 500 Index will be positive through 2025, leading us to believe that earnings growth among U.S. high-yield issuers could also be strong if they follow this historical pattern.
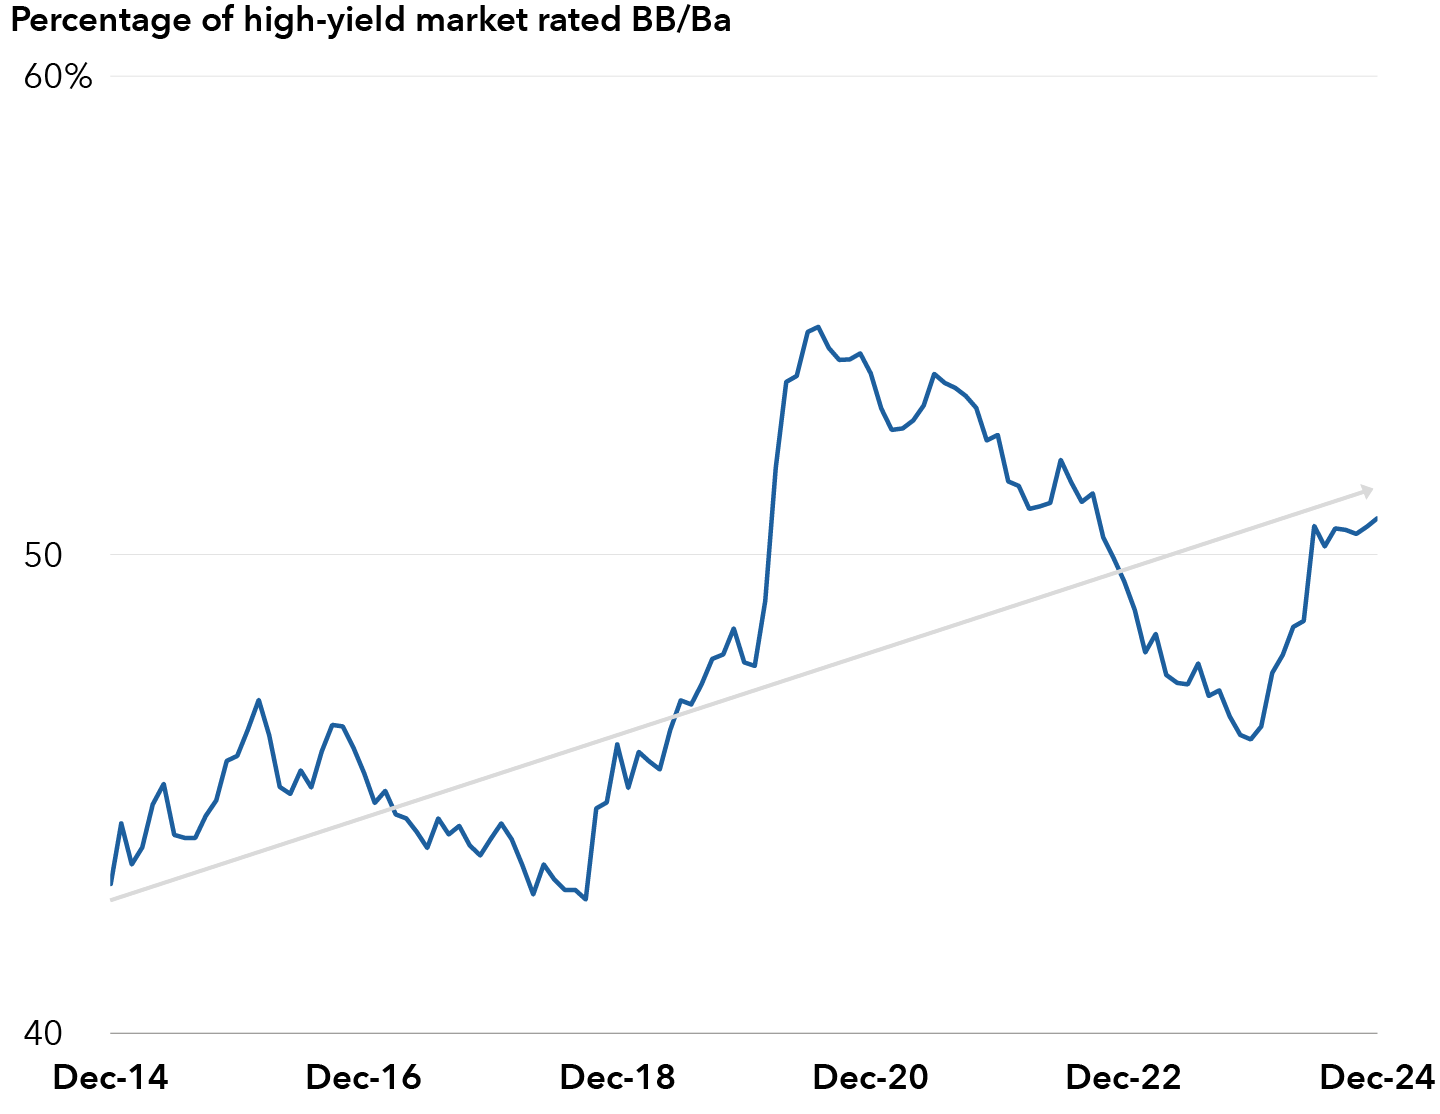
4. Credit quality: not last decade’s junk
In addition to the factors mentioned above, the average credit quality of the high-yield sector has increased significantly over the past 10 years, with more than 50% of the Bloomberg U.S. High Yield 2% Issuer Capped Index rated Ba as of December 31, 2024. Meanwhile, the percentage of the index rated CCC or below has generally decreased over the same period. While this higher average credit quality may justify some of the spread tightening we’ve seen in the sector in recent years, we believe higher credit quality should lead to lower price volatility and default rates, thereby reducing an investor’s risk in owning high yield.
5. An opportunity to rebalance
With equity markets currently at or near all-time highs, we believe many investors should reconsider their portfolio’s equity risk exposure. Those with a long-term income focus might consider rebalancing some of their risk exposure from equities to high yield. For example, investors might lower their allocation to dividend stocks and add to high yield as a means to potentially increase current income and decrease portfolio volatility. Over the past five years, for example, high-yield bond income has outpaced income from dividend stocks within the S&P 500 Index and the S&P 500 Dividend Aristocrats Index with lower average volatility.
High yield’s average yield has exceeded that of dividend-paying stocks
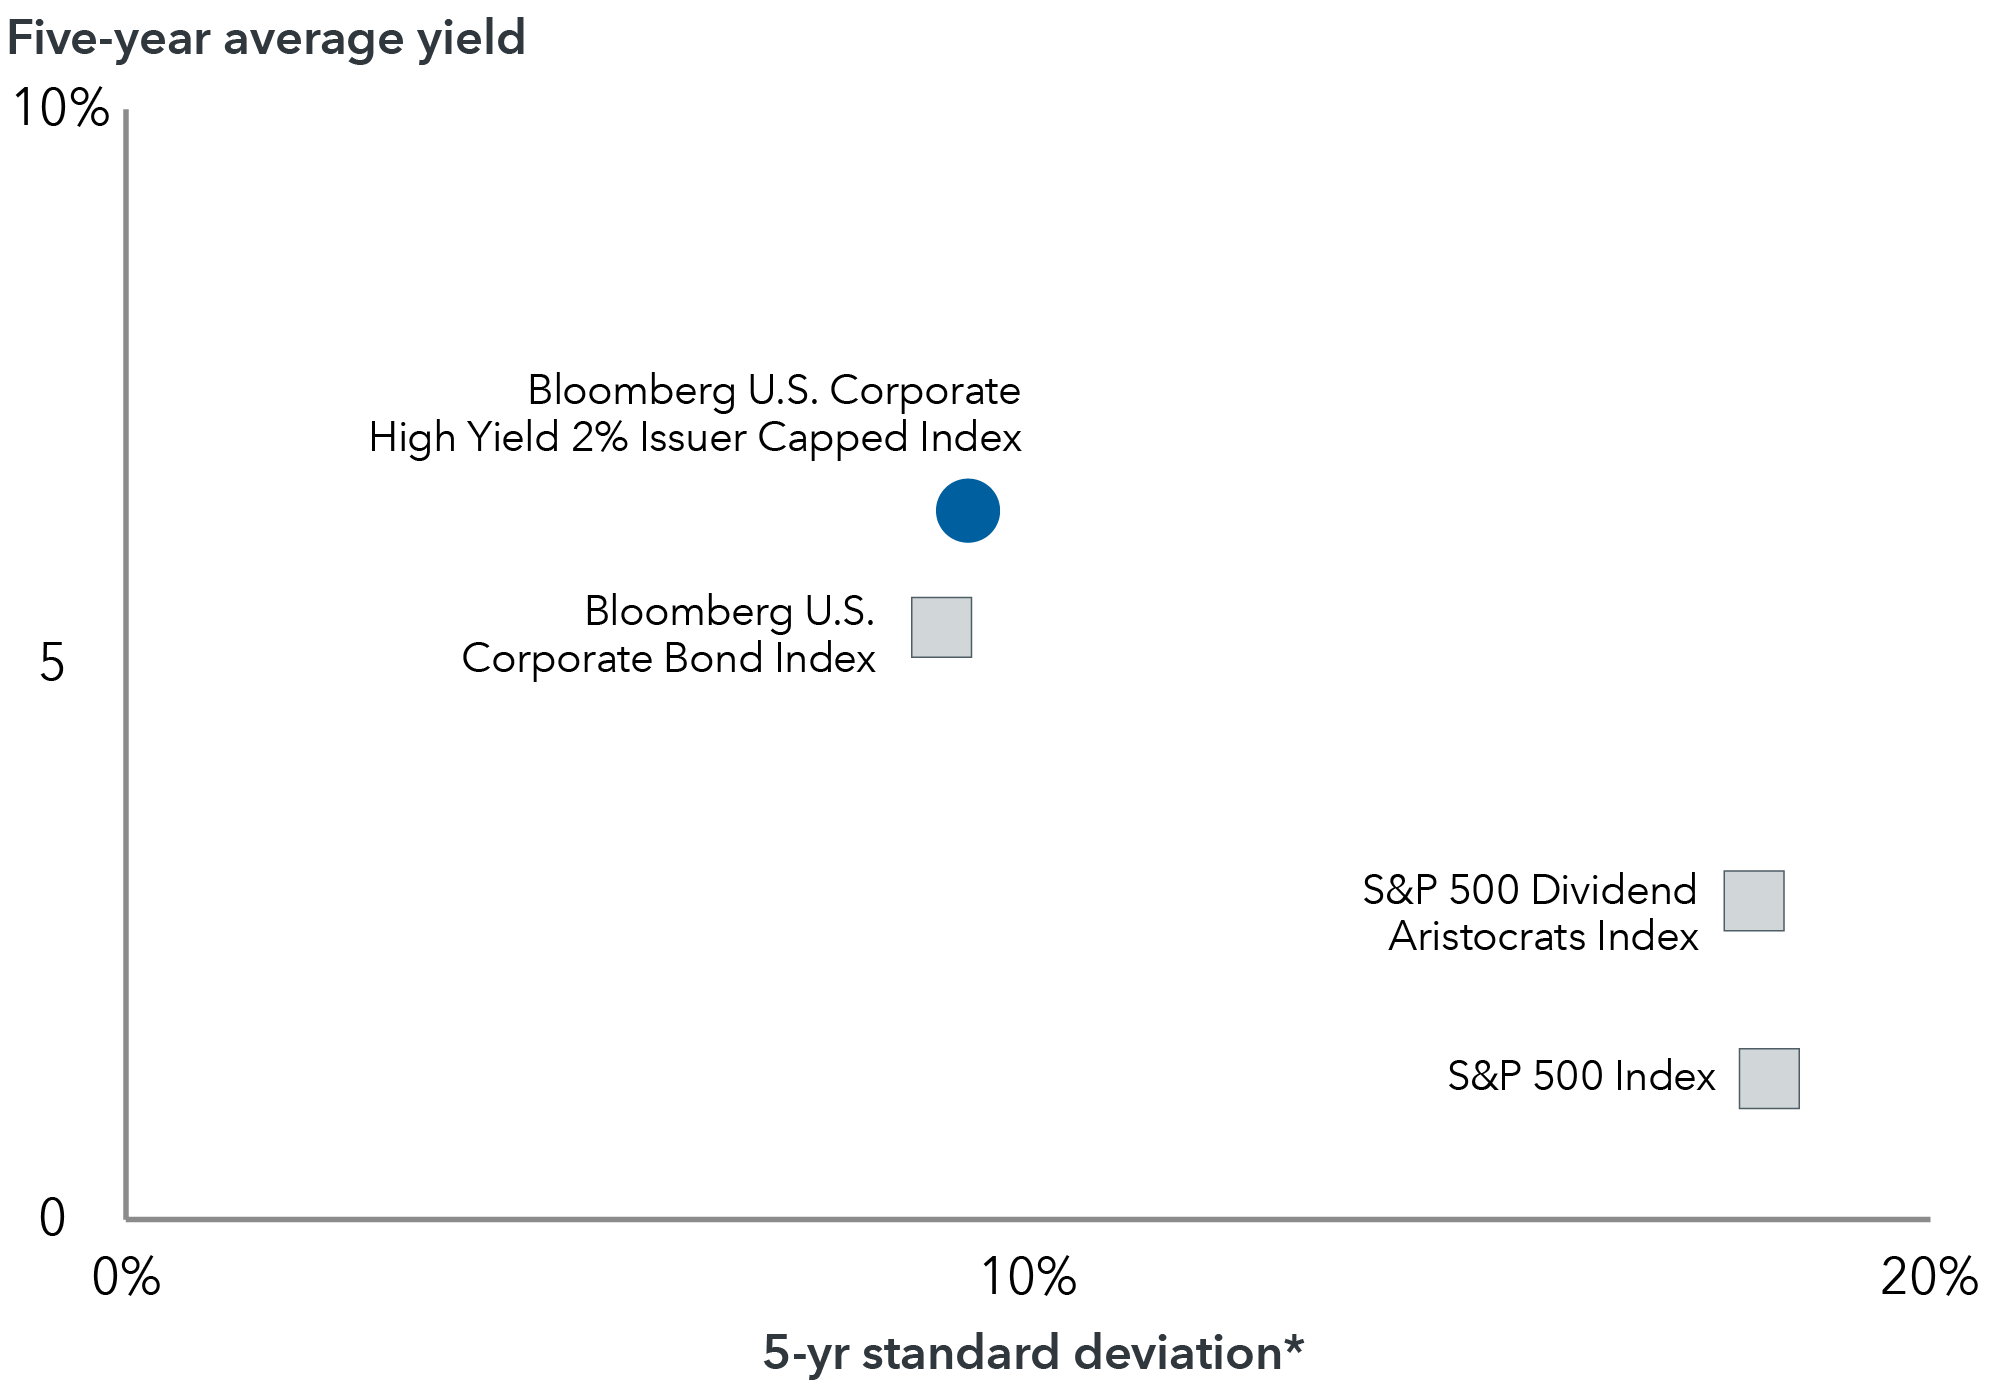
Source: Bloomberg. As of 12/31/24. *In investment terms, standard deviation measures the degree of variation of returns from the average (mean) return. A lower number signifies lower volatility. Past results are not predictive of results in future periods.
A more nuanced approach to high yield
Investors often use high-yield spreads as an indicator of when to invest in the sector. Still, we believe historical analysis demonstrates that factors such as YTW, earnings growth among the constituents of the S&P 500 Index and average credit quality can help provide a more accurate view of potential forward high yield returns. Although it’s natural for investors to be concerned with tight spreads, trying to market-time one’s allocation to high yield may be much more difficult and costly than one may expect. Against this backdrop, we urge long-term investors to take a broader, more nuanced approach to the sector. Ultimately, high yield can potentially provide strong current income and returns over many market cycles — and potentially with lower volatility than equities.
Learn more about
Bond ratings, which typically range from AAA/Aaa (highest) to D (lowest), are assigned by credit rating agencies such as Standard & Poor's, Moody's and/or Fitch, as an indication of an issuer's creditworthiness.
Indexes are unmanaged and therefore have no expenses. Investors cannot invest directly in an index.
Bloomberg U.S. Aggregate Index measures the performance of the investment-grade, USD-denominated, fixed-rate taxable bond market.
Bloomberg U.S. Corporate High Yield 2% Issuer Capped Index covers the universe of fixed-rate, non-investment-grade debt. The index limits the maximum exposure of any one issuer to 2%.
Bloomberg U.S. Corporate Index measures the investment grade, fixed-rate, taxable corporate bond market. It includes USD-denominated securities publicly issued by U.S. and non-U.S. industrial, utility, and financial issuers.
Bloomberg U.S. ABS ex AAA Index represents the universe of U.S. asset-backed securities, excluding issuers with credit ratings of AAA, the highest credit quality rating.
Source: Bloomberg Index Services Limited. BLOOMBERG® is a trademark and service mark of Bloomberg Finance L.P. and its affiliates (collectively “Bloomberg”). Bloomberg or Bloomberg’s licensors own all proprietary rights in the Bloomberg Indices. Neither Bloomberg nor Bloomberg’s licensors approves or endorses this material or guarantees the accuracy or completeness of any information herein, or makes any warranty, express or implied, as to the results to be obtained therefrom and, to the maximum extent allowed by law, neither shall have any liability or responsibility for injury or damages arising in connection therewith.
S&P 500 Index is a market capitalization-weighted index based on the results of approximately 500 widely held common stocks.
S&P High Yield Dividend Aristocrats® index is designed to measure the performance of companies within the S&P Composite 1500® that have followed a managed-dividends policy of consistently increasing dividends every year for at least 20 years.
The S&P 500 Index (“Index”) is a product of S&P Dow Jones Indices LLC and/or its affiliates and has been licensed for use by Capital Group. Copyright © 2025 S&P Dow Jones Indices LLC, a division of S&P Global, and/or its affiliates. All rights reserved. Redistribution or reproduction in whole or in part is prohibited without written permission of S&P Dow Jones Indices LLC.
J.P. Morgan EMBI Global Diversified Index is a uniquely weighted emerging market debt benchmark that tracks total returns for U.S. dollar-denominated bonds issued by emerging market sovereign and quasi-sovereign entities.
This report, and any product, index or fund referred to herein, is not sponsored, endorsed or promoted in any way by J.P. Morgan or any of its affiliates who provide no warranties whatsoever, express or implied, and shall have no liability to any prospective investor, in connection with this report.
Don't miss our latest insights.
Our latest insights
-
-
Market Volatility
-
-
Asset Allocation
-
World Markets Review
RELATED INSIGHTS
-
Asset Allocation
-
Regulation & Legislation
-
Market Volatility
Don’t miss out
Get the Capital Ideas newsletter in your inbox every other week
Investments are not FDIC-insured, nor are they deposits of or guaranteed by a bank or any other entity, so they may lose value.
Investors should carefully consider investment objectives, risks, charges and expenses.
This and other important information is contained in the prospectuses and summary prospectuses, which can be obtained from a financial professional and should be read carefully before investing.
The use of derivatives involves a variety of risks, which may be different from, or greater than, the risks associated with investing in traditional securities, such as stocks and bonds.
Lower rated bonds are subject to greater fluctuations in value and risk of loss of income and principal than higher rated bonds.
The return of principal for bond portfolios and portfolios with significant underlying bond holdings is not guaranteed. Investments are subject to the same interest rate, inflation and credit risks associated with the underlying bond holdings.
Investing outside the United States involves risks, such as currency fluctuations, periods of illiquidity and price volatility. These risks may be heightened in connection with investments in developing countries.
All Capital Group trademarks mentioned are owned by The Capital Group Companies, Inc., an affiliated company or fund. All other company and product names mentioned are the property of their respective companies.
Use of this website is intended for U.S. residents only.
Capital Client Group, Inc.
This content, developed by Capital Group, home of American Funds, should not be used as a primary basis for investment decisions and is not intended to serve as impartial investment or fiduciary advice.