Health Care
Categories
International Equities
5 charts on what’s powering international stocks
 Bobby Chada
 Samir Parekh
 Chris Thomsen
October 1, 2025
International stocks have long played second fiddle to the U.S. and the staggering rise of its technology sector. But for the first time in many years, the picture is brightening for non-U.S. stocks, fueled by new growth tailwinds.
International stocks have been out of favor due to concerns about tepid economic growth, lack of innovation and regulatory overreach. Here are five charts that shed light on the recovery and factors that could help sustain a long-term rebound.
1. International stocks take the lead
Non-U.S. stocks have had a bright start to the year, pacing global markets through the first nine months of 2025.
Sentiment has shifted, fueled by new catalysts such as large-scale German stimulus, a recognition among governments for greater self-sufficiency, a weakening dollar and a decline in energy costs following a surge when Russia invaded Ukraine in 2022.
Non-U.S. markets pull away from Mag 7 and U.S.
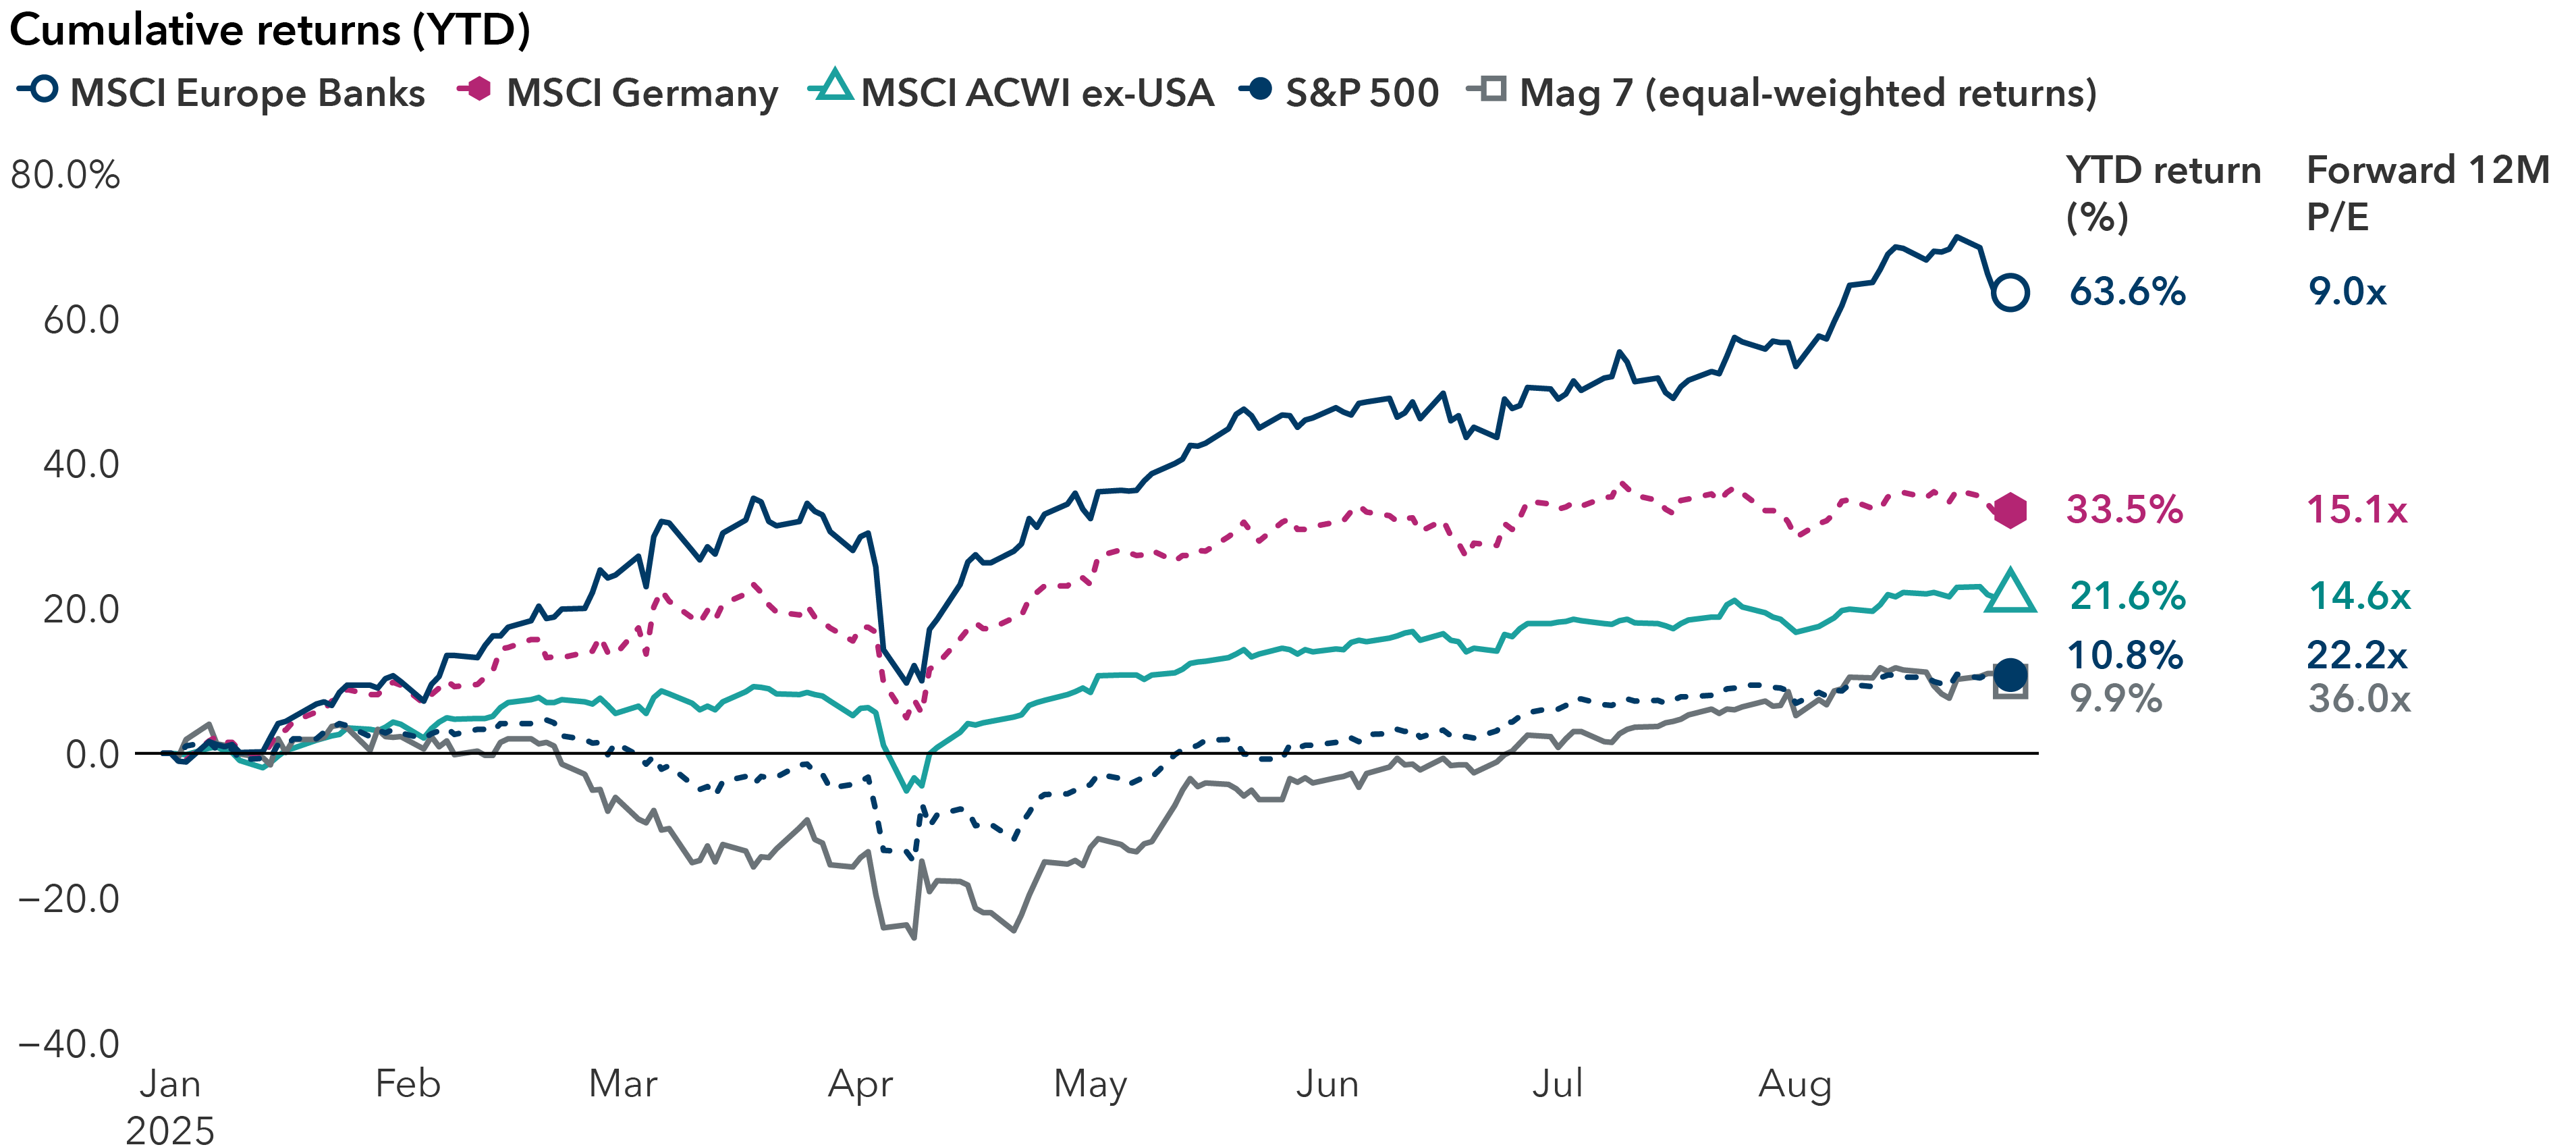
Sources: Capital Group, FactSet, RIMES. P/E = price-to-earnings. Mag 7 = Alphabet, Amazon, Apple, Meta, Microsoft, NVIDIA and Tesla. Return figures are based on total returns in USD. Data from January 1, 2025, to August 29, 2025. The forward price-to-earnings (P/E) ratio is computed by dividing the stock price by the consensus forward 12-month earnings estimates. Forward P/E ratio for the Mag 7 is the market-cap weighted average as of August 29, 2025. Past results are not predictive of results in future periods. The indexes are unmanaged and, therefore, have no expenses. Investors cannot invest directly in an index.
2. Tailwinds from a weaker dollar
Sustained dollar weakness has often aided international stocks, helping returns for U.S.-based investors when local currencies are converted back to dollars. Currency effects have helped drive close to half of the returns for the MSCI EAFE and MSCI Europe indices in 2025. For the year to date through September, the dollar has fallen 12% against the euro, 7% against the British pound and 6% against the Japanese yen.
International stocks tend to benefit from weaker dollar
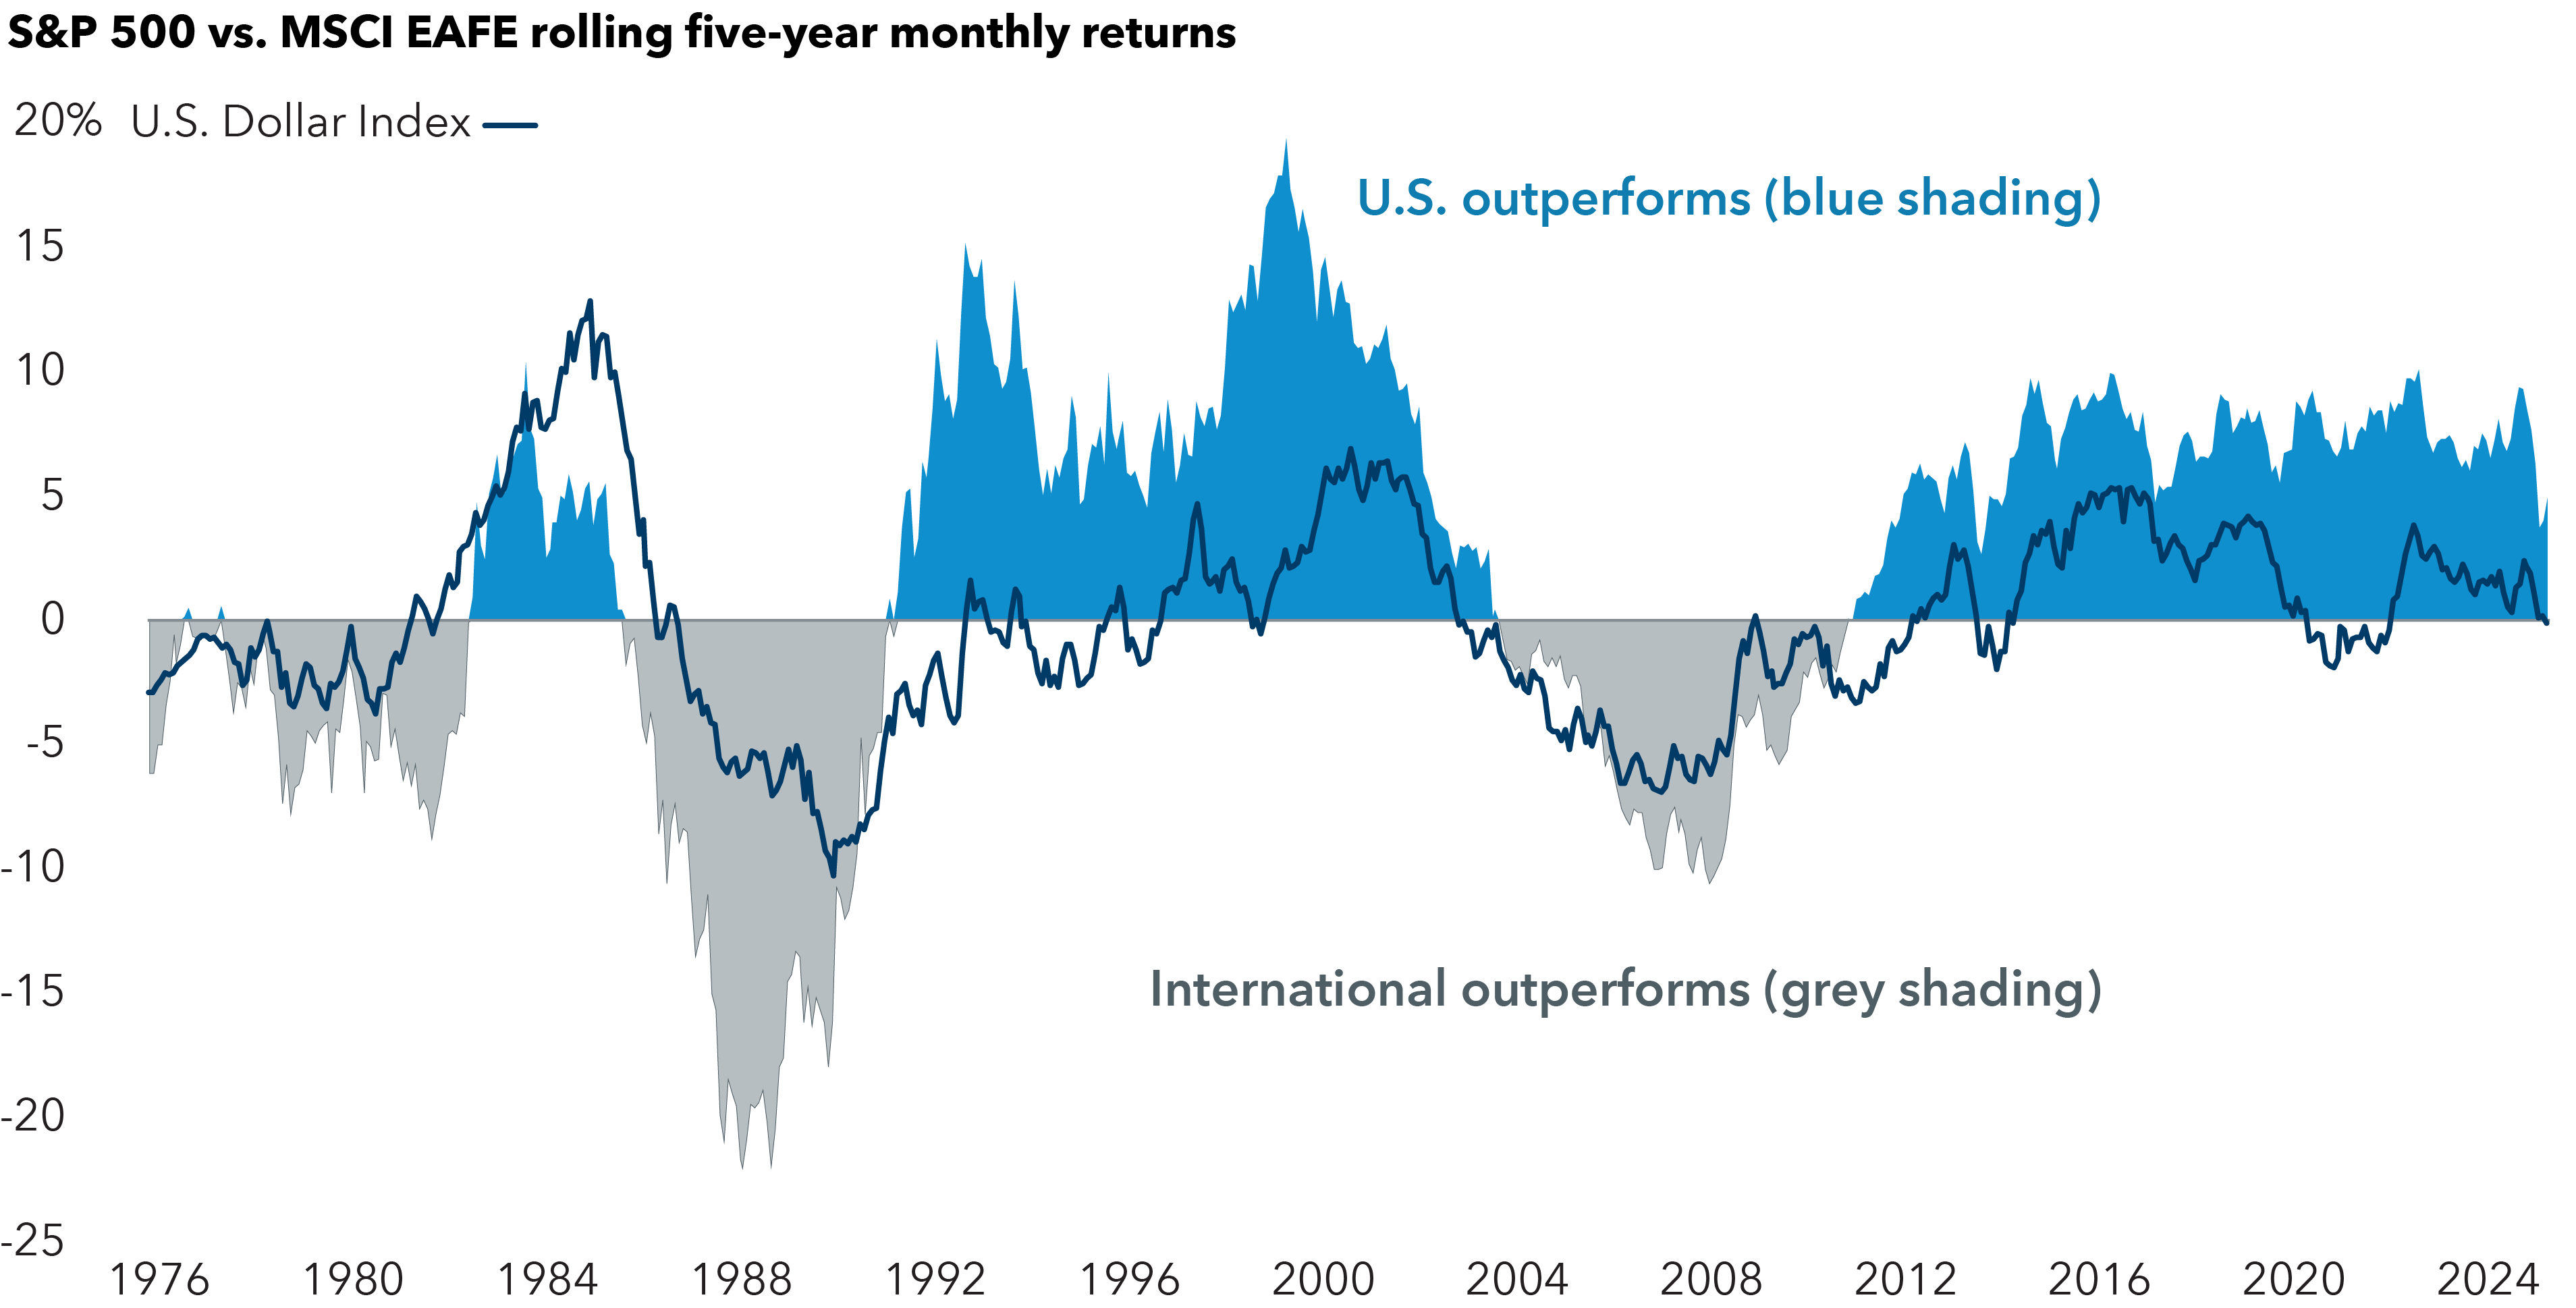
Sources: Capital Group, MSCI, S&P Dow Jones Indices, LLC. U.S. = S&P 500 Index. International = MSCI EAFE Index. U.S. Dollar Index is a measure of value relative to the value of a basket of currencies of the majority of the U.S.'s most significant trading partners. Relative returns are measured on an annualized rolling 5-year total return basis in USD. Data from January 1, 1976, to August 31, 2025. Past results are not predictive of results in future periods.
3. An earnings recovery is underway
Earnings growth has trailed the U.S. and its vibrant technology sector over the past decade. The trajectory appears to be changing, with earnings growth for European companies more comparable with those in the U.S. If there is a rebound across international markets, price-to-earnings ratios could re-rate higher.
Earnings growth may accelerate in Europe
Source: FactSet. Data as of August 28, 2025. E = estimated. CAGR = compound annual growth rate.
4. New tailwinds boost banks, aerospace, defense
European banks have had a stellar run, outpacing the Mag-7 group of U.S. technology leaders and the S&P 500 Index since August 2024. Interest rates have normalized following a period of negative rates from 2014 to 2022. Banks have amassed significant capital, loan losses are not anticipated and dividend payments have increased as regulatory requirements have been relaxed.
Commercial aerospace firms are riding multiple tailwinds that could help boost earnings, margin power and cash flows. There’s strong demand, tight supply, great pricing power and growth visibility over a long cycle.
On another front, European and Asian countries plan to spend more on defense. NATO allies pledged in June to ramp up their defense spending from a targeted 2% of gross domestic product (GDP) to 5% by 2035, a monumental change that reflects an ongoing transformation of the geopolitical landscape. Spending may be limited by national budgets, but more funding should still help defense firms.
European banks surpass U.S. in profitability
Source: FactSet. Data as of December 31, 2024.
5. Valuations are still reasonable
For many years, an argument for owning international equities has been cheaper valuations compared with similar U.S. businesses. Even after strong gains in non-U.S. equity markets, valuations remain attractive thanks to new growth drivers.
The MSCI ACWI ex USA Index trades at 14.6 earnings on a 12-month forward basis, while the MSCI EAFE (developed international) trades at 15.1 times — both below their 10-year averages and at a substantial discount to the S&P 500 Index, which trades at 22.8 times earnings.
In an environment where infrastructure spending rises, non-U.S. markets are more diverse and weighted higher in heavy industry, energy, materials and chemicals than the S&P 500 Index. They are also less concentrated. The top 10 companies make up 11.2% of the overall weight in MSCI ACWI ex USA Index vs. 37.9% in the S&P 500 Index (as of August 29).
International stocks trade near 20-year low relative to U.S.
Sources: Capital Group, FactSet, MSCI. As of August 31, 2025. NTM = next twelve months. P/E = price-to-earnings.
A turning point for international stocks?
Inflection points in markets tend to prompt investors to take a fresh look at asset allocation. Germany’s unprecedented stimulus, greater national security in several countries, a weaker dollar and undemanding valuations are among them. Year-to-date portfolio flows can be read as a signal that investors are looking to broaden their equity exposure and risk beyond the dominant U.S. technology companies.
It won’t be an overnight shift. But for investors with a longer term horizon, history shows global equity markets tend to move in cycles. Perhaps this is the next turn.
Learn more about
The Magnificent Seven stocks consist of Alphabet, Amazon, Apple, Meta, Microsoft, NVIDIA and Tesla.
MSCI ACWI ex USA Index is a free-float-adjusted, market-capitalization-weighted index that measures equity market results in the global developed and emerging markets, excluding the United States.
MSCI EAFE® (Europe, Australasia, Far East) Index is a free float-adjusted market capitalization weighted index that is designed to measure developed equity market results, excluding the United States and Canada.
MSCI Europe Index is designed to measure the performance of equity markets in 15 developed countries in Europe.
MSCI Europe Banks Index is composed of large- and mid-cap stocks across Developed Markets countries in Europe. All securities in the index are classified in the Banks industry group (within the financials sector) according to the Global Industry Classification Standards (GICS®).
MSCI Germany Index is designed to measure the performance of the large- and mid-cap segments of the German market.
MSCI USA Index is a free-float-adjusted, market-capitalization-weighted index that is designed to measure the U.S. portion of the world market.
S&P 500 Index is a market capitalization-weighted index based on the results of approximately 500 widely held common stocks.
Don't miss our latest insights.
Our latest insights
-
-
Chart in Focus
-
Chart in Focus
-
Emerging Markets
-
RELATED INSIGHTS
-
World Markets Review
-
Economic Indicators
-
World Markets Review
Don’t miss out
Get the Capital Ideas newsletter in your inbox every other week
Investments are not FDIC-insured, nor are they deposits of or guaranteed by a bank or any other entity, so they may lose value.
Past results are not predictive of results in future periods.
Investing outside the United States involves risks, such as currency fluctuations, periods of illiquidity and price volatility. These risks may be heightened in connection with investments in developing countries.
There have been periods when the results lagged the index(es) and/or average(s).
The indexes are unmanaged and, therefore, have no expenses. Investors cannot invest directly in an index.
Source: MSCI. The MSCI information may only be used for your internal use, may not be reproduced or redisseminated in any form and may not be used as a basis for or a component of any financial instruments or products or indices. None of the MSCI information is intended to constitute investment advice or a recommendation to make (or refrain from making) any kind of investment decision and may not be relied on as such. Historical data and analysis should not be taken as an indication or guarantee of any future performance analysis, forecast or prediction. The MSCI information is provided on an “as is” basis and the user of this information assumes the entire risk of any use made of this information. MSCI, each of its affiliates and each other person involved in or related to compiling, computing or creating any MSCI information (collectively, the “MSCI Parties”) expressly disclaims all warranties (including, without limitation, any warranties of originality, accuracy, completeness, timeliness, non-infringement, merchantability and fitness for a particular purpose) with respect to this information. Without limiting any of the foregoing, in no event shall any MSCI Party have any liability for any direct, indirect, special, incidental, punitive, consequential (including, without limitation, lost profits) or any other damages. Please visit the data provider's website for more information.
Each S&P Index ("Index") shown is a product of S&P Dow Jones Indices LLC and/or its affiliates and has been licensed for use by Capital Group. Copyright © 2026 S&P Dow Jones Indices LLC, a division of S&P Global, and/or its affiliates. All rights reserved. Redistribution or reproduction in whole or in part is prohibited without written permission of S&P Dow Jones Indices LLC.
Statements attributed to an individual represent the opinions of that individual as of the date published and do not necessarily reflect the opinions of Capital Group or its affiliates. This information is intended to highlight issues and should not be considered advice, an endorsement or a recommendation.
All Capital Group trademarks mentioned are owned by The Capital Group Companies, Inc., an affiliated company or fund. All other company and product names mentioned are the property of their respective companies.
Use of this website is intended for U.S. residents only.
Capital Client Group, Inc.
This content, developed by Capital Group, home of American Funds, should not be used as a primary basis for investment decisions and is not intended to serve as impartial investment or fiduciary advice.