
The year 2025 has not been the most favorable to municipal bonds, but 2026 appears to be shaping up for better results. And as active investors, we see many areas of opportunity. The municipal bond team is positioning portfolios defensively but opportunistically.
October 30, 2025
1. Supply dynamics could turn favorable in 2026
In 2025, tax-exempt municipal bonds (represented by the Bloomberg Municipal Bond Index and the Bloomberg High Yield Municipal Bond Index) lagged taxable bonds (represented by the Bloomberg U.S. Aggregate Index) due to unique supply-demand pressures. Traditional buyers like property and casualty (P&C) insurance companies reduced their tax-exempt muni purchases, partly due to lower corporate tax rates and attractive yields in taxable markets. Meanwhile, municipal issuance increased by nearly 20% year-over-year.
The higher supply of munis is partially due to issuers facing rising project costs. Our expectation is for municipal bond supply to moderate in 2026 as issuers had front-loaded many projects in 2025 in anticipation of rising costs and potentially higher long-term interest rates. Supply should taper so long as interest rates remain stable within a range.
As supply rose, demand in some segments of the market didn’t keep pace. These factors created a supply-demand imbalance: higher tax-exempt yields relative to comparable taxable bonds, and thus weaker price performance for tax-exempt munis.
Toward the end of the year, we are seeing yield-driven investors test the market, and in any episodes of dramatic yield widening, we expect to see these investors invest more aggressively. As the U.S. Federal Reserve lowers interest rates, some of the uncertainty around interest rates should dissipate, allowing medium-term and long-term interest rates to settle in a range. We expect municipal bonds to do better against a more stable and benign interest rate environment, and the muni-Treasury ratio (which compares AAA or highest quality municipal bond yields to those of U.S. Treasuries) will potentially improve.
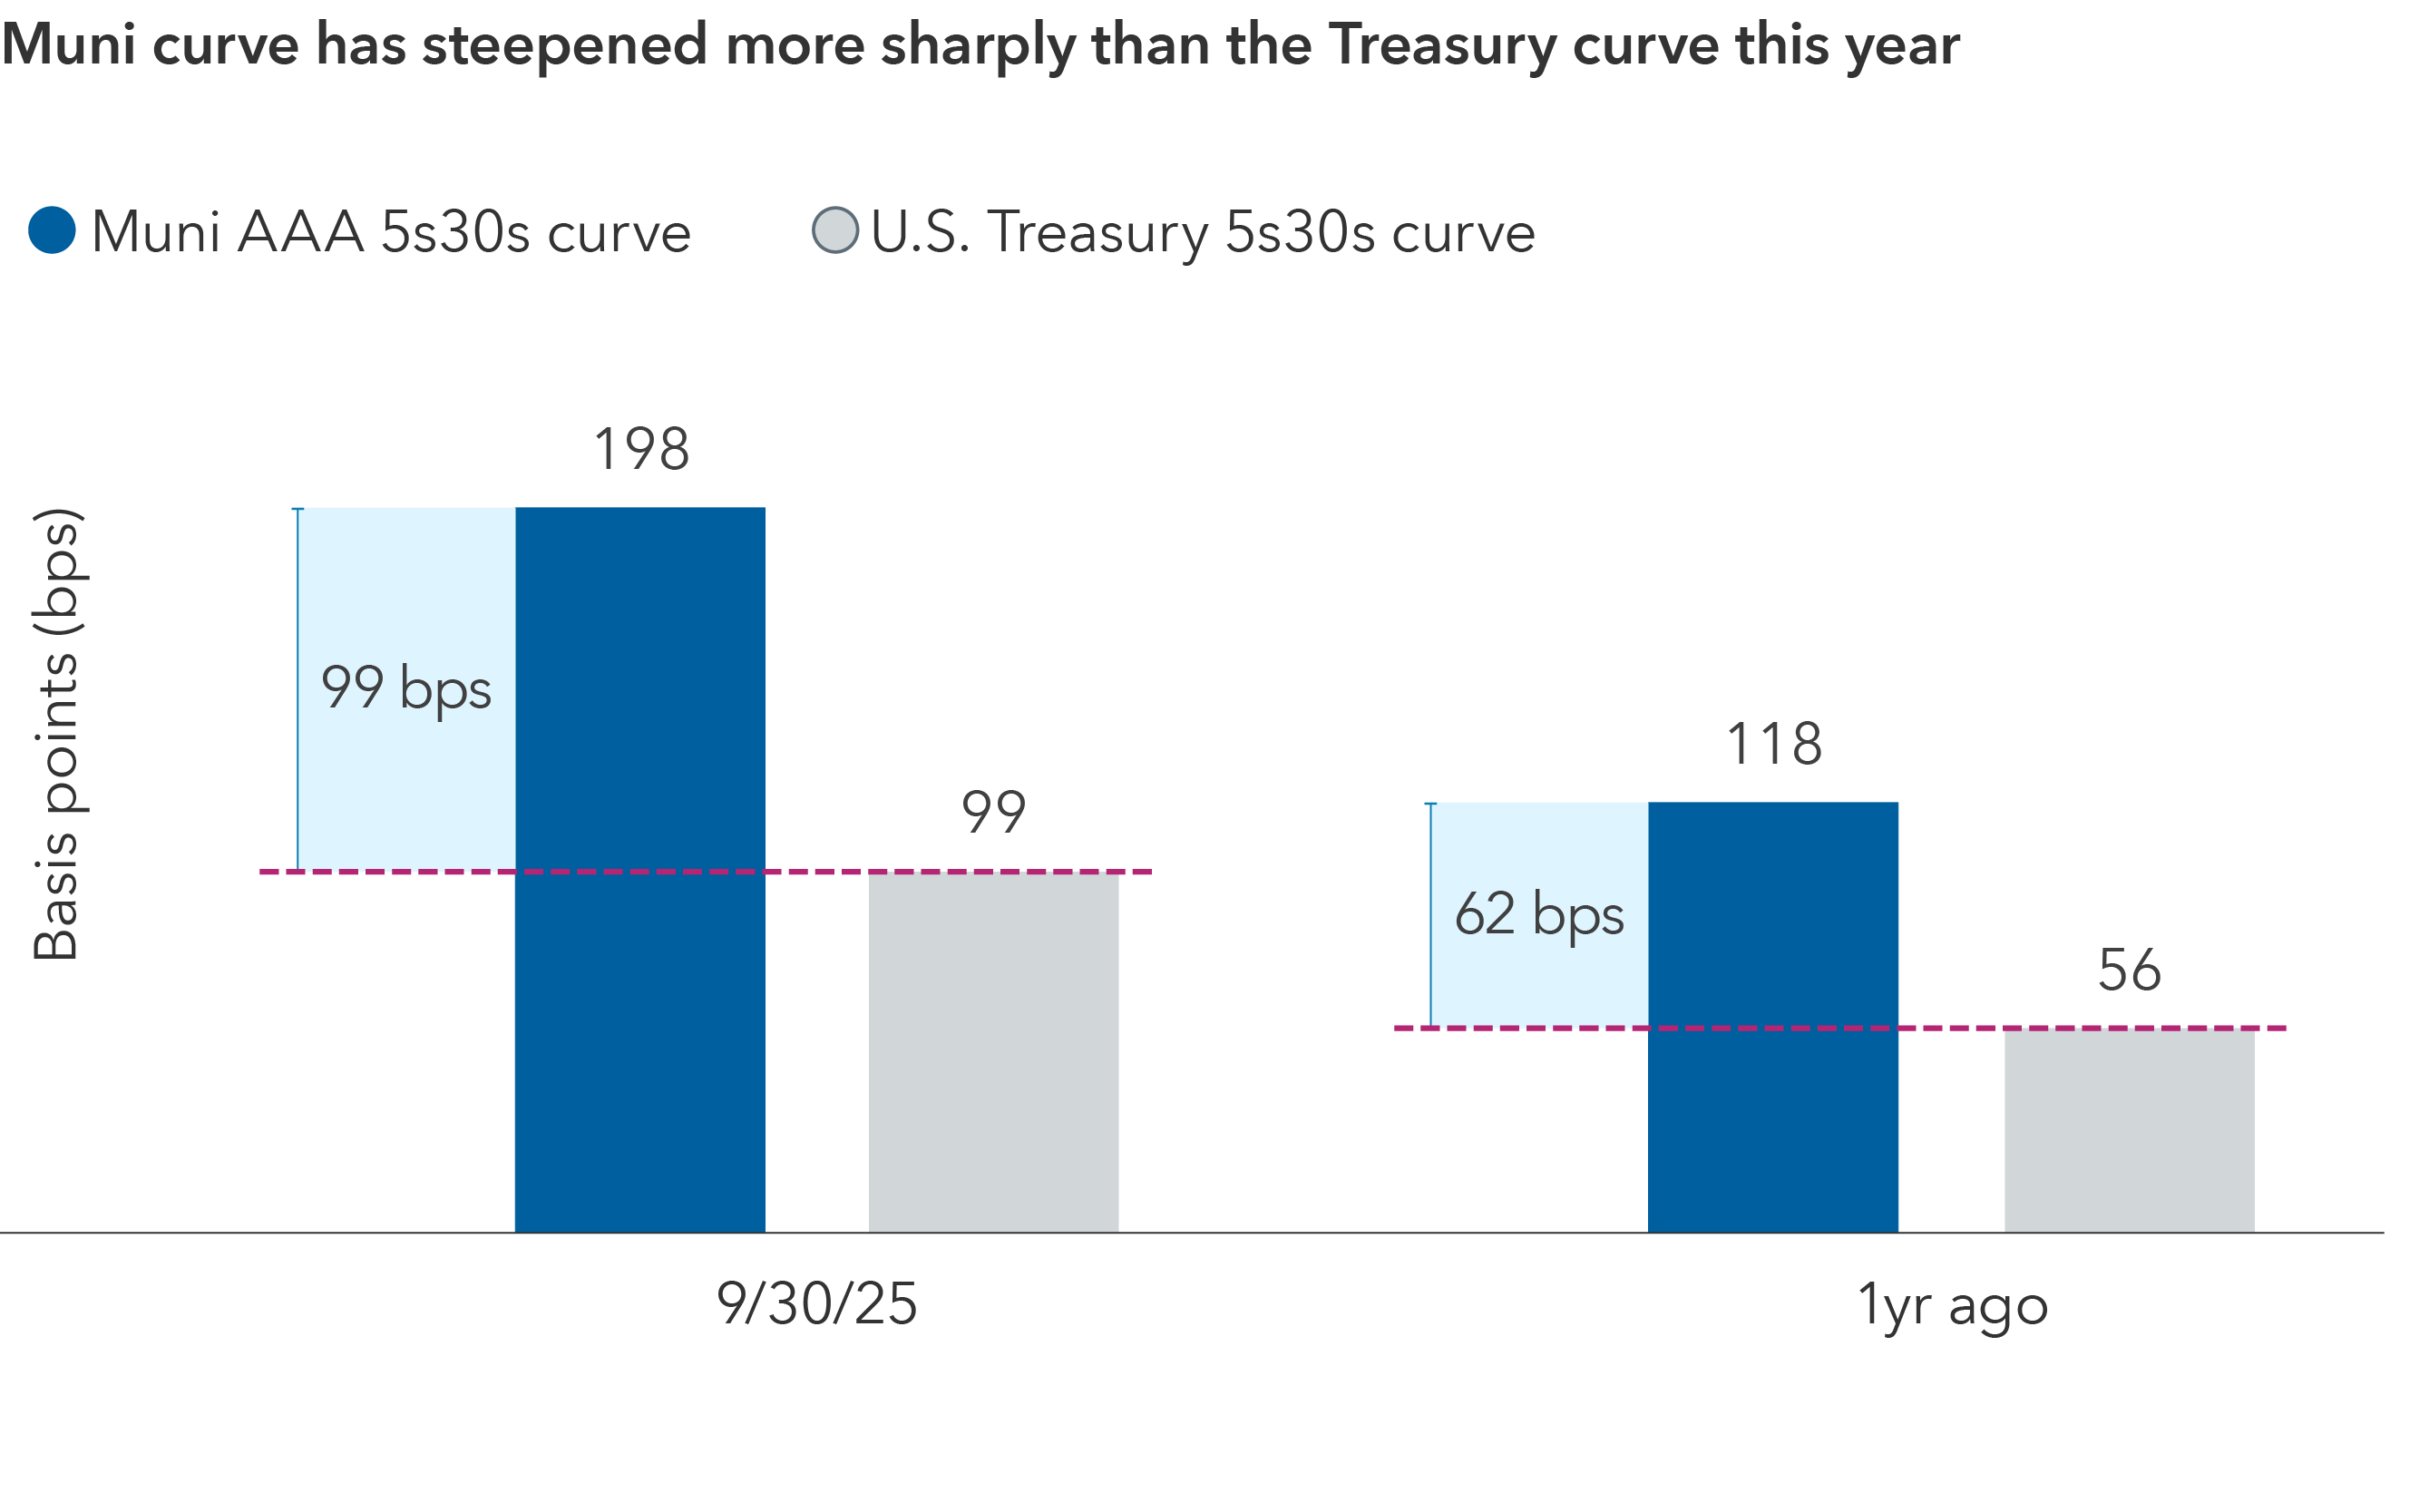
Source: Bloomberg. Data as of 9/30/25. Bars indicate the spread between the 5-year and 30-year yields on the respective curves. Curves shown for U.S. Treasury and BVAL tax-exempt munis.
2. Adjusting portfolios to buffer against political and headline risk
The One Big Beautiful Bill Act modified some rules and the funding profile for the Medicaid system that will have an impact on hospital systems, which are a large part of the muni bond universe. We believe it could take several years for the impact to show up in financial statements. We don't have a sense these Medicaid provisions will be that impactful for the vast majority of healthcare systems in the U.S. that are well capitalized and not very dependent on Medicaid.
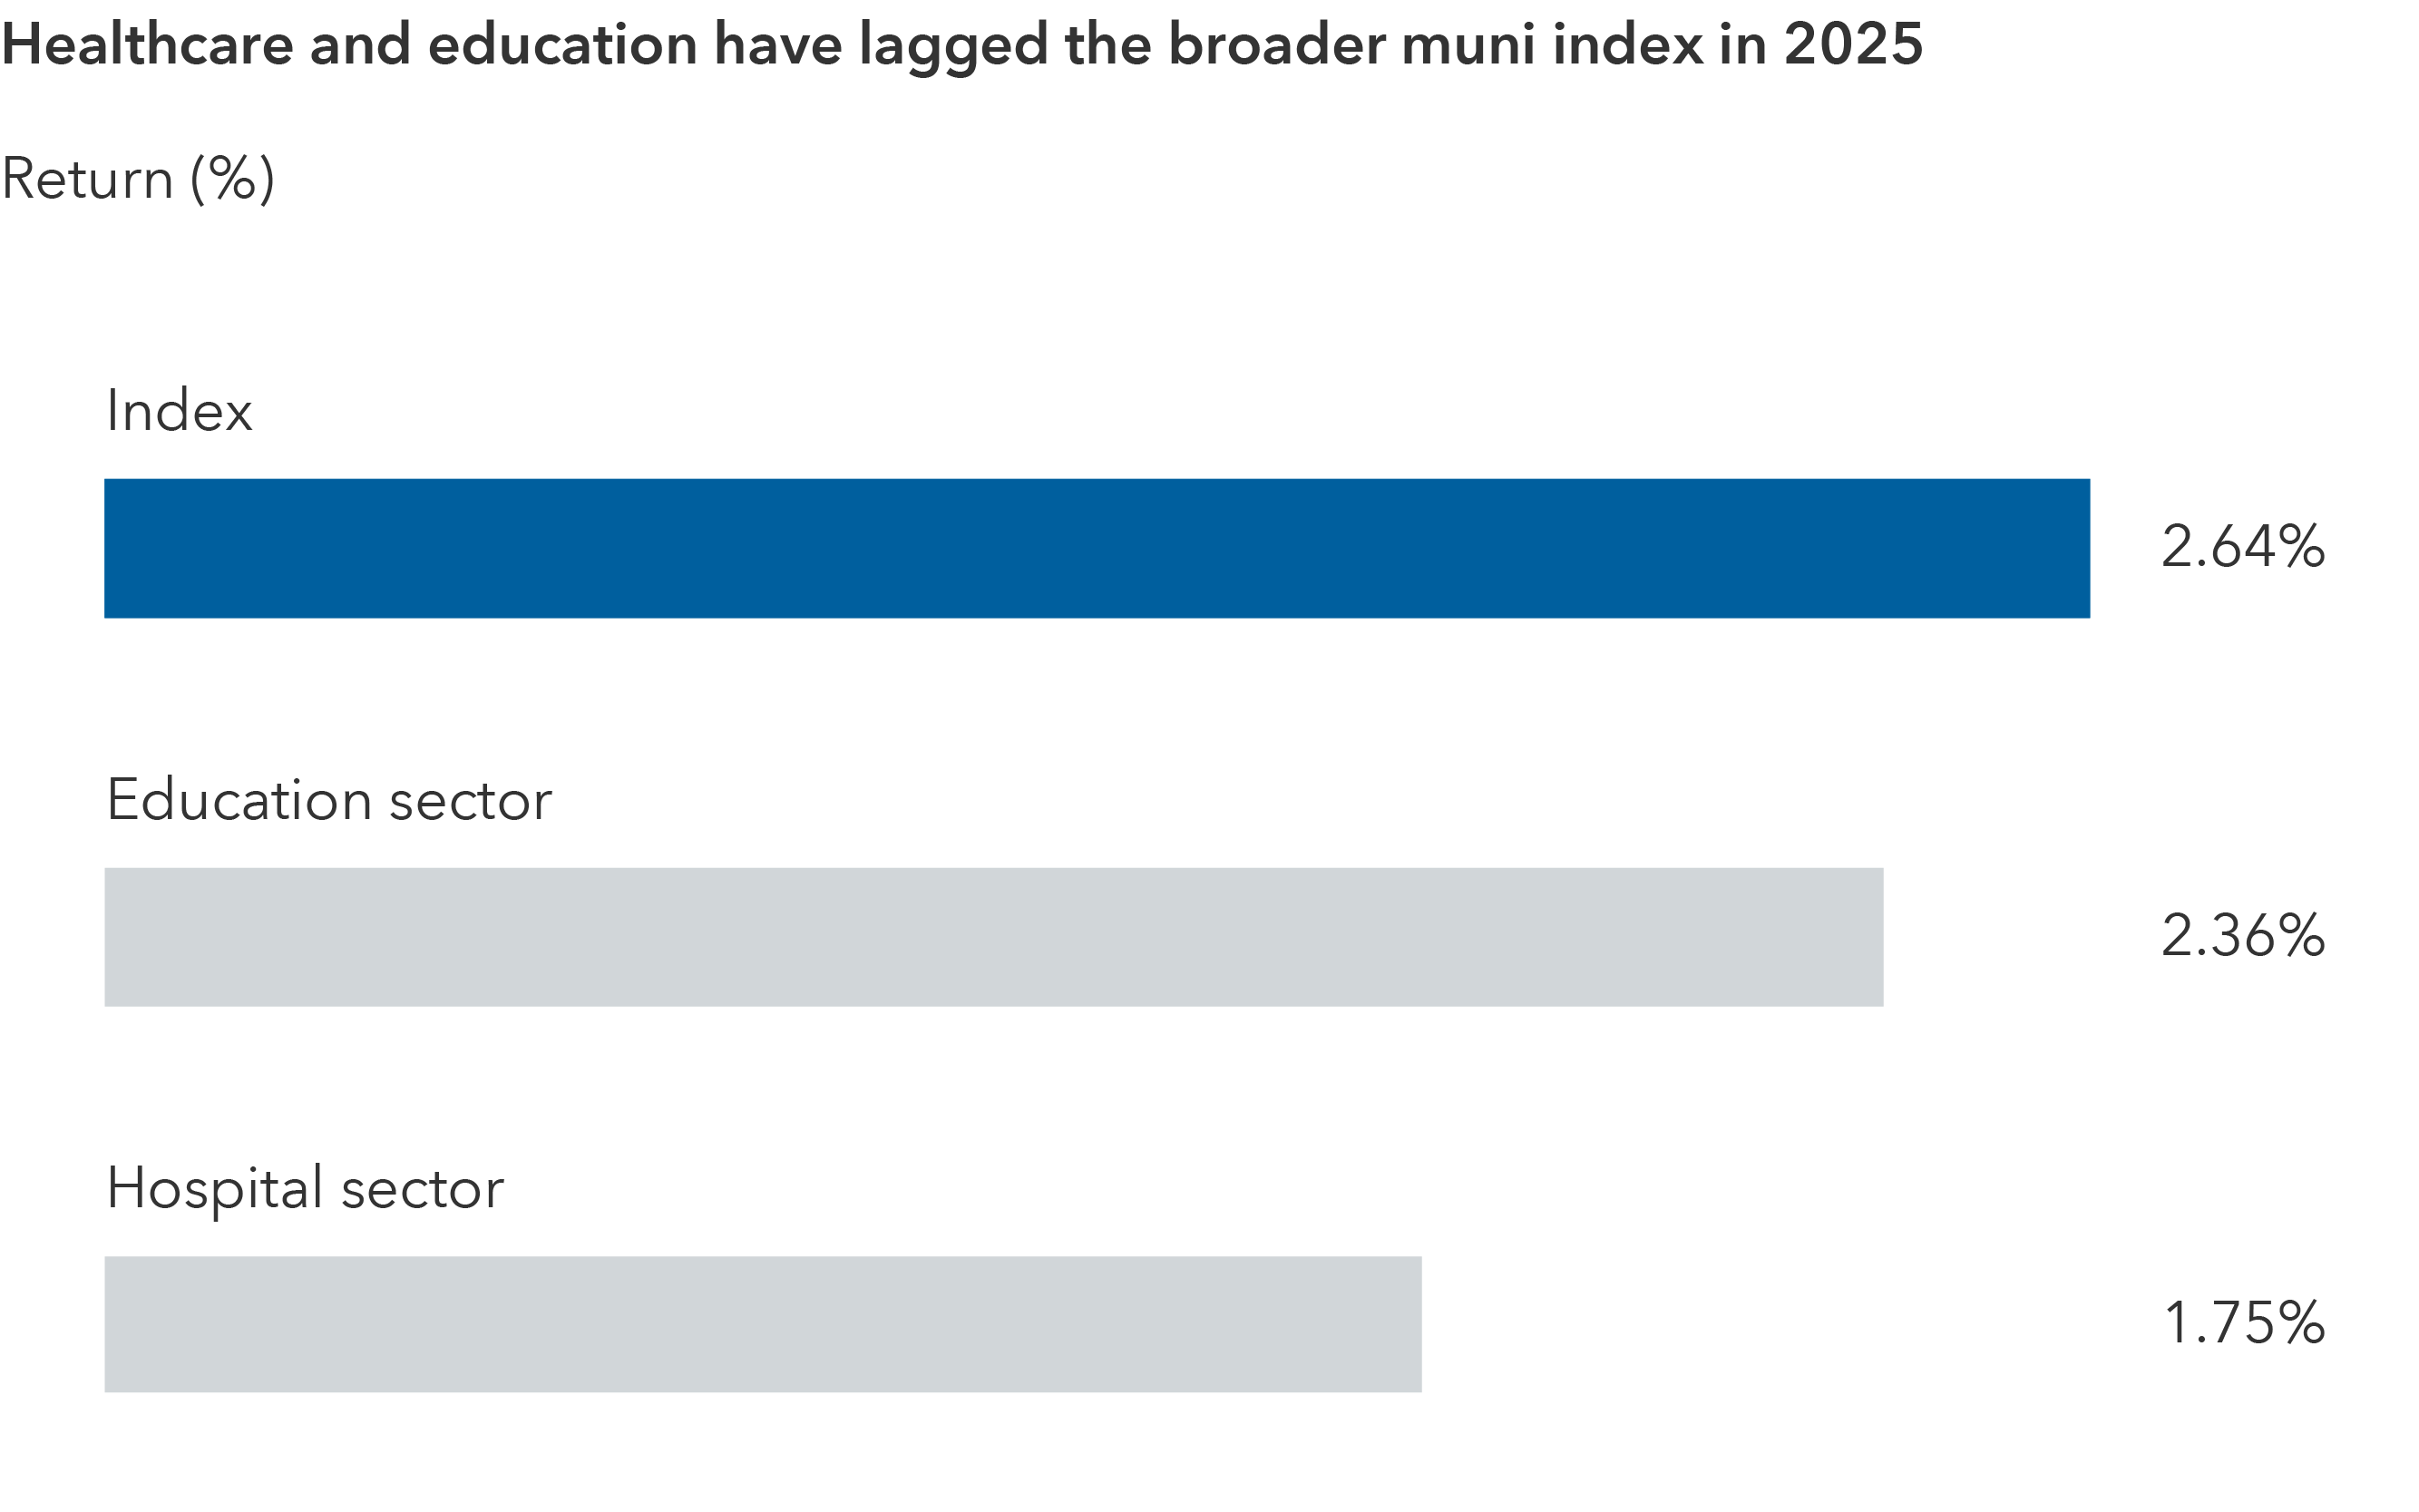
Source: Bloomberg. Data as of 9/30/25. Index is represented by the Bloomberg Municipal Bond Index. Sectors are index components.
Against this backdrop, we have grown more selective on hospital bonds, with a preference for larger systems and systems in states with stable policy support. For example, we favor bonds from hospital systems that benefited from pandemic aid and have strong balance sheets. Simultaneously, we generally avoid rural hospitals in states that are considering funding cuts or where politics may impede Medicaid reimbursements.
The other area of focus from evolving public policy is education bonds. Our experience in 2025 has taught us that policy risk can manifest slowly but materially. We repositioned some exposures earlier in the year. For example, we trimmed holdings in certain university systems where governance turmoil emerged and added to selective private universities with strong endowments (less political risk) after thorough due diligence. We maintain positions in well funded school districts.
In considering public universities, we scrutinize states’ higher education budgets. Some states have implemented tuition caps or funding cuts due to political agendas, which could stress university finances. We focus on flagship state universities with strong demand and state support. On the other hand, we tend to avoid smaller colleges that are heavily reliant on state decisions or face enrollment declines. When we consider school districts, we note certain districts have become political battlegrounds – controversial issues range from property tax funding to charter school expansion. We remain cautious on those where political fights could limit funding flexibility. As such, we favor districts with diverse revenue streams and a growing tax base.
3. Credit selection has become key as post-Covid stimulus fades
The post-COVID era was unusual in that the extensive federal stimulus provided to most public entities lifted all boats and default rates hit historical lows from 2021 to 2023.
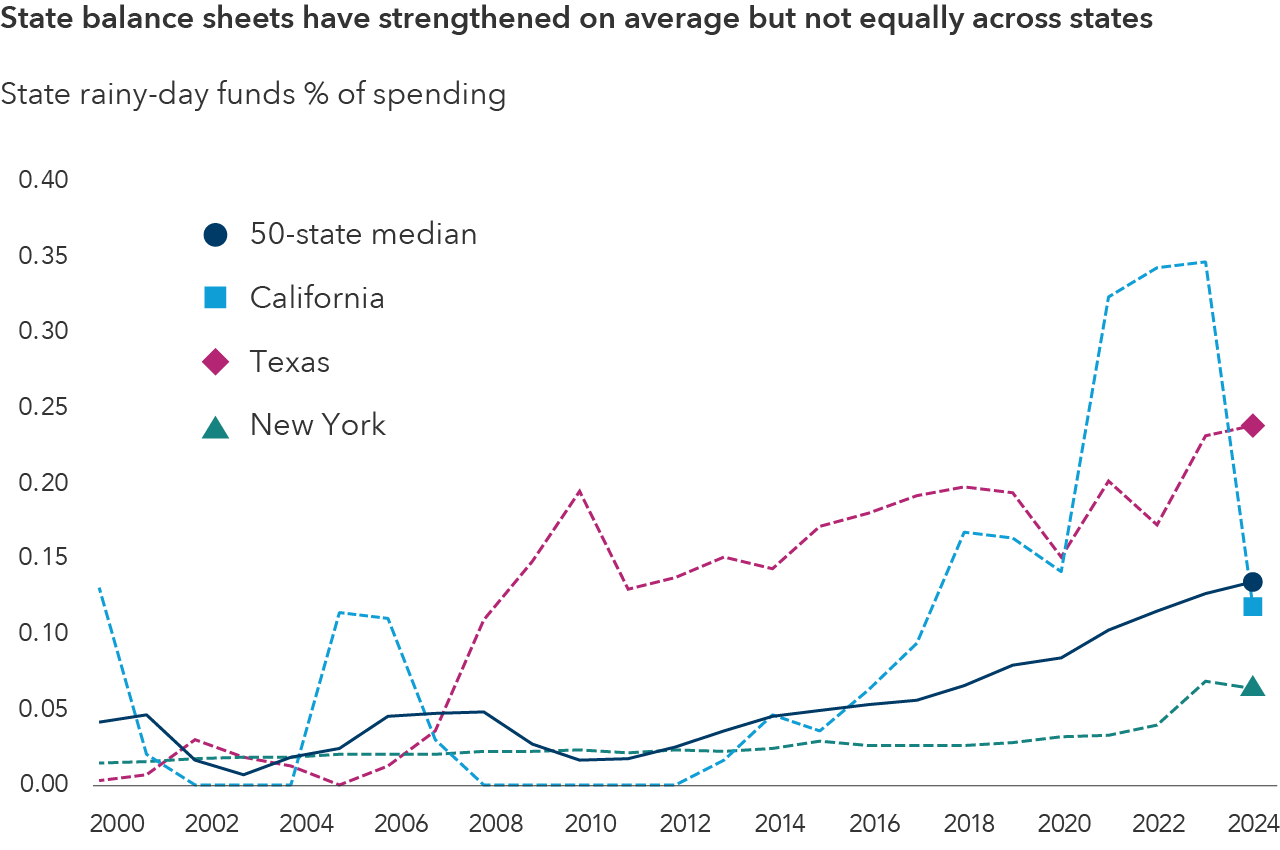
Source: Pew Research. Three largest states by population shown. As of 12/31/24.
But not all public institutions used the funds wisely. Many issuers improved their balance sheets with the aid, for example, increasing reserves, paying down debt, funding capital improvements or invested in projects with lower future costs. They may maintain higher credit ratings or a stable outlook even as the stimulus fades. Issuers that relied on stimulus to plug budget holes without implementing any reforms now face renewed fiscal stress. We’ve seen widening credit spreads or rating pressure for some such entities. In some cases, the strong are becoming stronger, while the weak are becoming weaker.
As markets become more fundamental-driven, we expect credit quality to matter more, and we expect greater dispersion in valuations along the quality spectrum.
We are closely evaluating how these entities have emerged post-stimulus. For example, we noted certain municipalities used federal aid to boost their rainy-day funds to record levels and invested in infrastructure that spurred economic development. We view this as positive, and as a result, maintain positions in these municipalities, thus recognizing good financial stewardship. Within the hospital sector, we noted certain obligors that used relief funds to pay down debt and invest in profitable outpatient clinics, leaving them with lower leverage and improved cash flow. We continue to prefer these bonds, expecting ratings upgrades or tighter spreads over time.
On the other hand, we also saw some instances of wasted stimulus. For example, some state transit authorities used one-time funds to maintain operations without addressing ridership decline or cost structure. With funds now gone, these transit authorities – yet again – face deficits. In another example, we noticed certain city governments that gave large wage increases or pension enhancements using federal money. Those costs are now structural, and without new revenue streams, the cities face budget crunches. As a result, we can seek higher yields to hold such credits or avoid them entirely.
4. Investing across the credit spectrum with an up-in-quality bias
Against the backdrop of an uncertain political and economic environment, we are maintaining an up-in-quality bias. Moreover, the yield dispersion between high-quality and low-quality muni bonds tightened significantly in 2024. Spreads between, for example, AAA-rated and high-yield muni yields narrowed to well below historical averages.
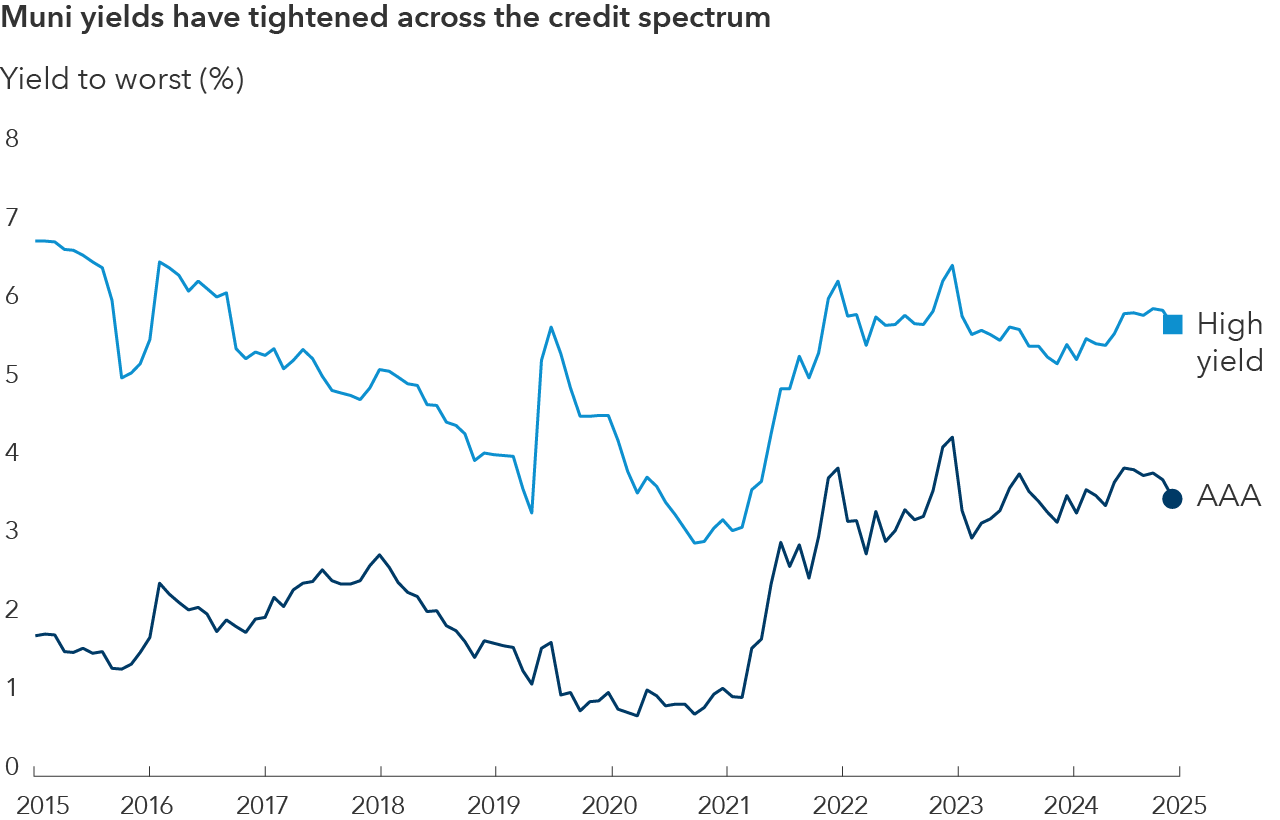
Source: Bloomberg. Data as of 9/30/25. High yield is represented by the Bloomberg High Yield Municipal Bond Index. AAA is represented by the Bloomberg Municipal AAA Index.
Despite an up-in-quality stance, we haven’t abandoned lower quality credits entirely. We retain some exposure to well researched high-yield muni credits like certain charter schools or senior living facilities where we see potential for financial stability and an adequate yield cushion. These credits provide high income, but it’s essential to continually monitor these credits for any sign of deterioration. While we continue to find distinct opportunities within the lower quality cohort, market dynamics would need to change to meaningfully increase exposure.
5. Unrated bonds are a growing and dynamic part of the market
Unrated bonds are an increasingly large part of the high-income muni market. Despite the lack of a quality grade assigned by a rating agency, many unrated bonds can exhibit strong quality (for example, well-secured local deals or non-profit issues), although caution is prudent, as some may be speculative.
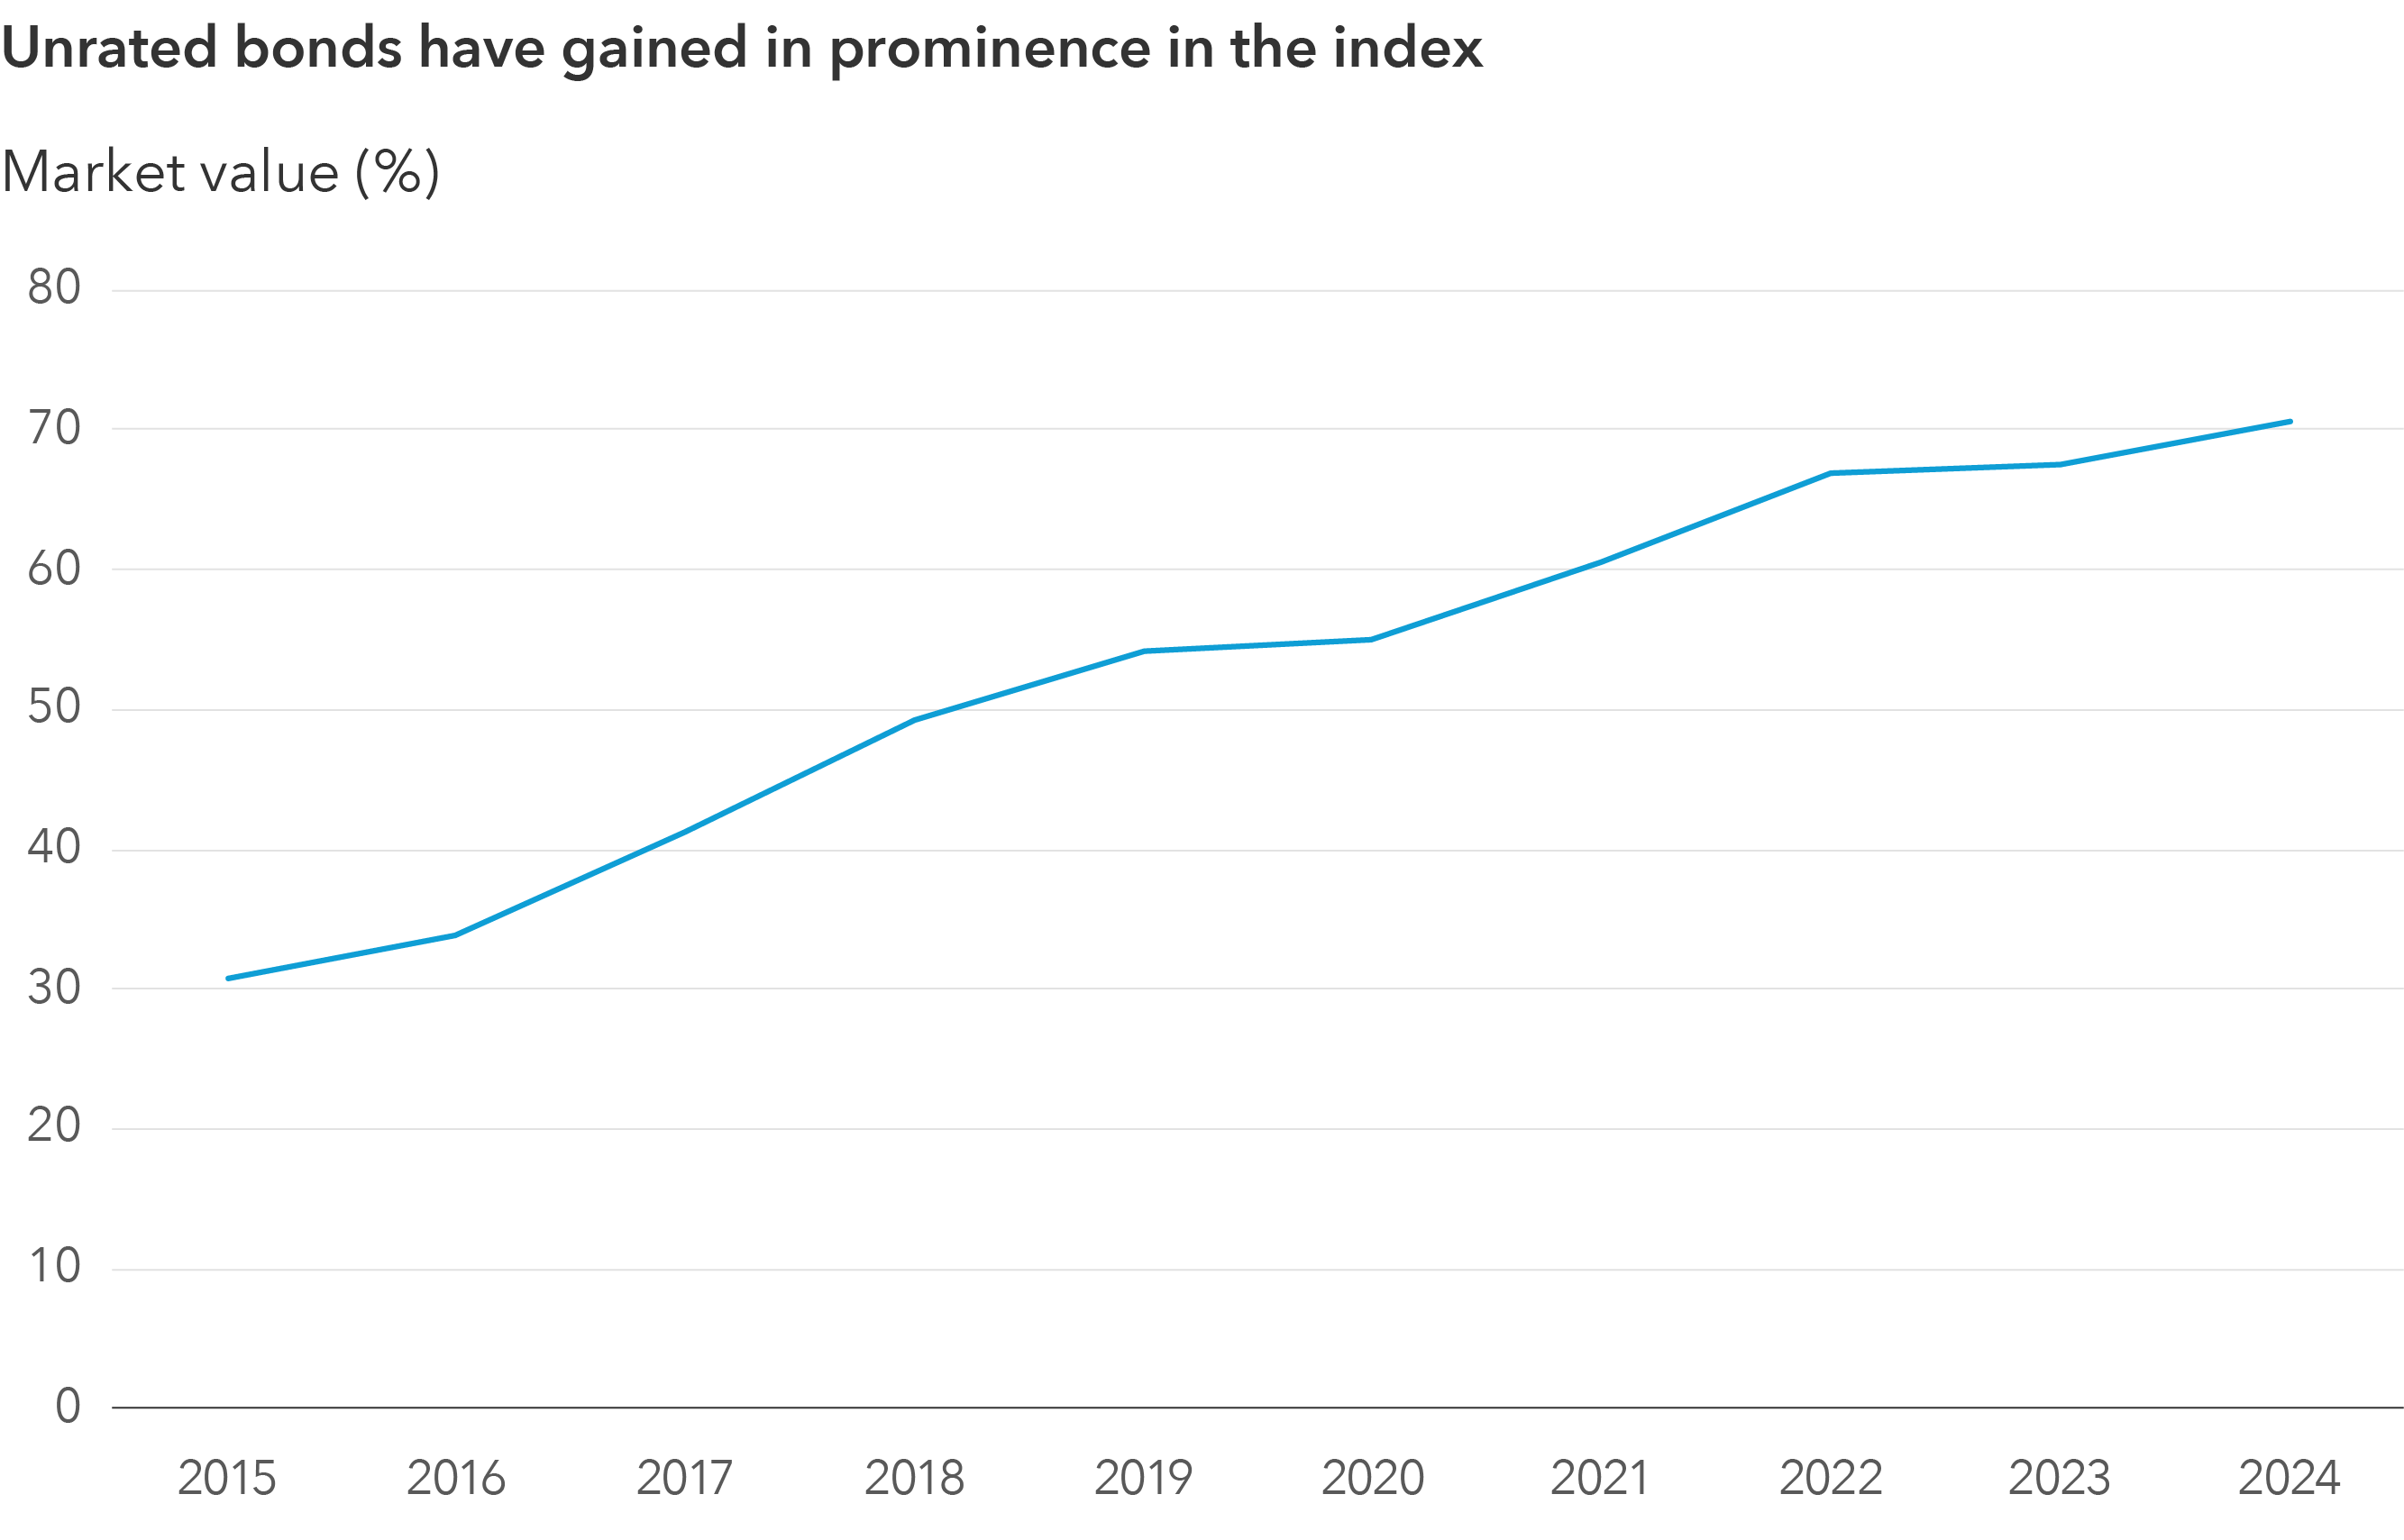
Source: Bloomberg. Data as of 12/31/24. Blue line represents the Bloomberg High Yield Muni Index.
A bond may be unrated for reasons unrelated to its quality. The issuer might not request a rating by an agency, feeling it is not worth the effort. Perhaps the issuer is small and doesn’t want to pay the cost to obtain a rating. In other cases, an issuer may not meet rating criteria or might prefer to provide a more attractive yield to compensate for the unrated status. In many cases, an unrated bond can be analyzed by our research team and given an internal rating, to compare it to similar credit risk opportunities.
Unrated bonds’ prominence has grown in our portfolios, but in a measured way. If the market continues to bring appealing unrated deals, we anticipate our allocation could grow. For example, charter school bonds often come unrated. We prefer those with strong test scores, waiting lists and solid financial support. If we believe the charter network is stable, we may invest modestly.
Our team has developed a robust capability in assessing unrated bonds, often finding value where traditional metrics might not be available. We treat unrated bonds as a research-intensive, opportunistic sleeve of the portfolio. Generally, we demand a yield premium (higher yield) for the uncertainty of no public rating. This is due not only to the additional research responsibility with more limited information but also to compensate for lower liquidity. As a part of our risk management process, we continually assess our exposure to unrated bonds alongside other considerations such as liquidity.
The bottom line
The municipal bond team maintains an up-in-quality bias, favoring higher grade and resilient issuers, while selectively adding lower quality bonds that offer compelling risk-adjusted returns. We hold relatively larger investments in select revenue sectors, such as tax-backed and student loans, and have relatively smaller investments in sectors with political or structural headwinds, such as some hospital and higher education institutions. This balanced approach aims to capture value from 2025’s dislocations while helping to shield municipal portfolios from volatility and potential economic downturns.
After a challenging 2025, we expect municipal bonds to enjoy better supply-demand dynamics, improved valuations and generally solid fundamentals. Investors willing to withstand near-term volatility can take advantage of the lower relative starting valuations.

Chad Rach is a fixed income portfolio manager with 32 years of investment industry experience (as of 12/31/2024). He holds an MBA from the University of Chicago and a bachelor's from Marquette University.

Lee Chu is a fixed income portfolio manager with 17 years of investment industry experience (as of 12/31/2025). She holds a bachelor’s degree in psychology from Brown University.