Market Volatility
Categories
Interest Rates
What happens if U.S. debt becomes unsustainable?
 Jason Davis
 Doug Kletter
 Arjun Madan
September 4, 2025
Is the U.S. national debt growing out of control? Predicting when or if a tipping point may be reached is difficult (or impossible), but the country faces growing fiscal challenges as its soaring interest burden is heightening concerns about long-term debt sustainability.
To be clear, there is no indication that a crisis is imminent. The U.S. federal government has operated with a deficit for much of its existence, and this has not resulted in significant challenges for either the bond market or the broader economy. That said, the increasingly perilous debt dynamics could eventually create problems without some sort of corrective measures. And it is prudent to examine the scenarios that could play out should it ever get to that point.
What is a sustainable level of yields for U.S. Treasuries?
Over the past two decades, U.S. debt held by the public has risen from about 60% of gross domestic product (GDP) to nearly 100% today, mainly due to the fallout from heightened deficits following the global financial crisis (GFC) and COVID-19. Forecasts like those from the Congressional Budget Office (CBO) project similar deficit spending for at least the next decade.
Deficits are expected to continue at or near current levels
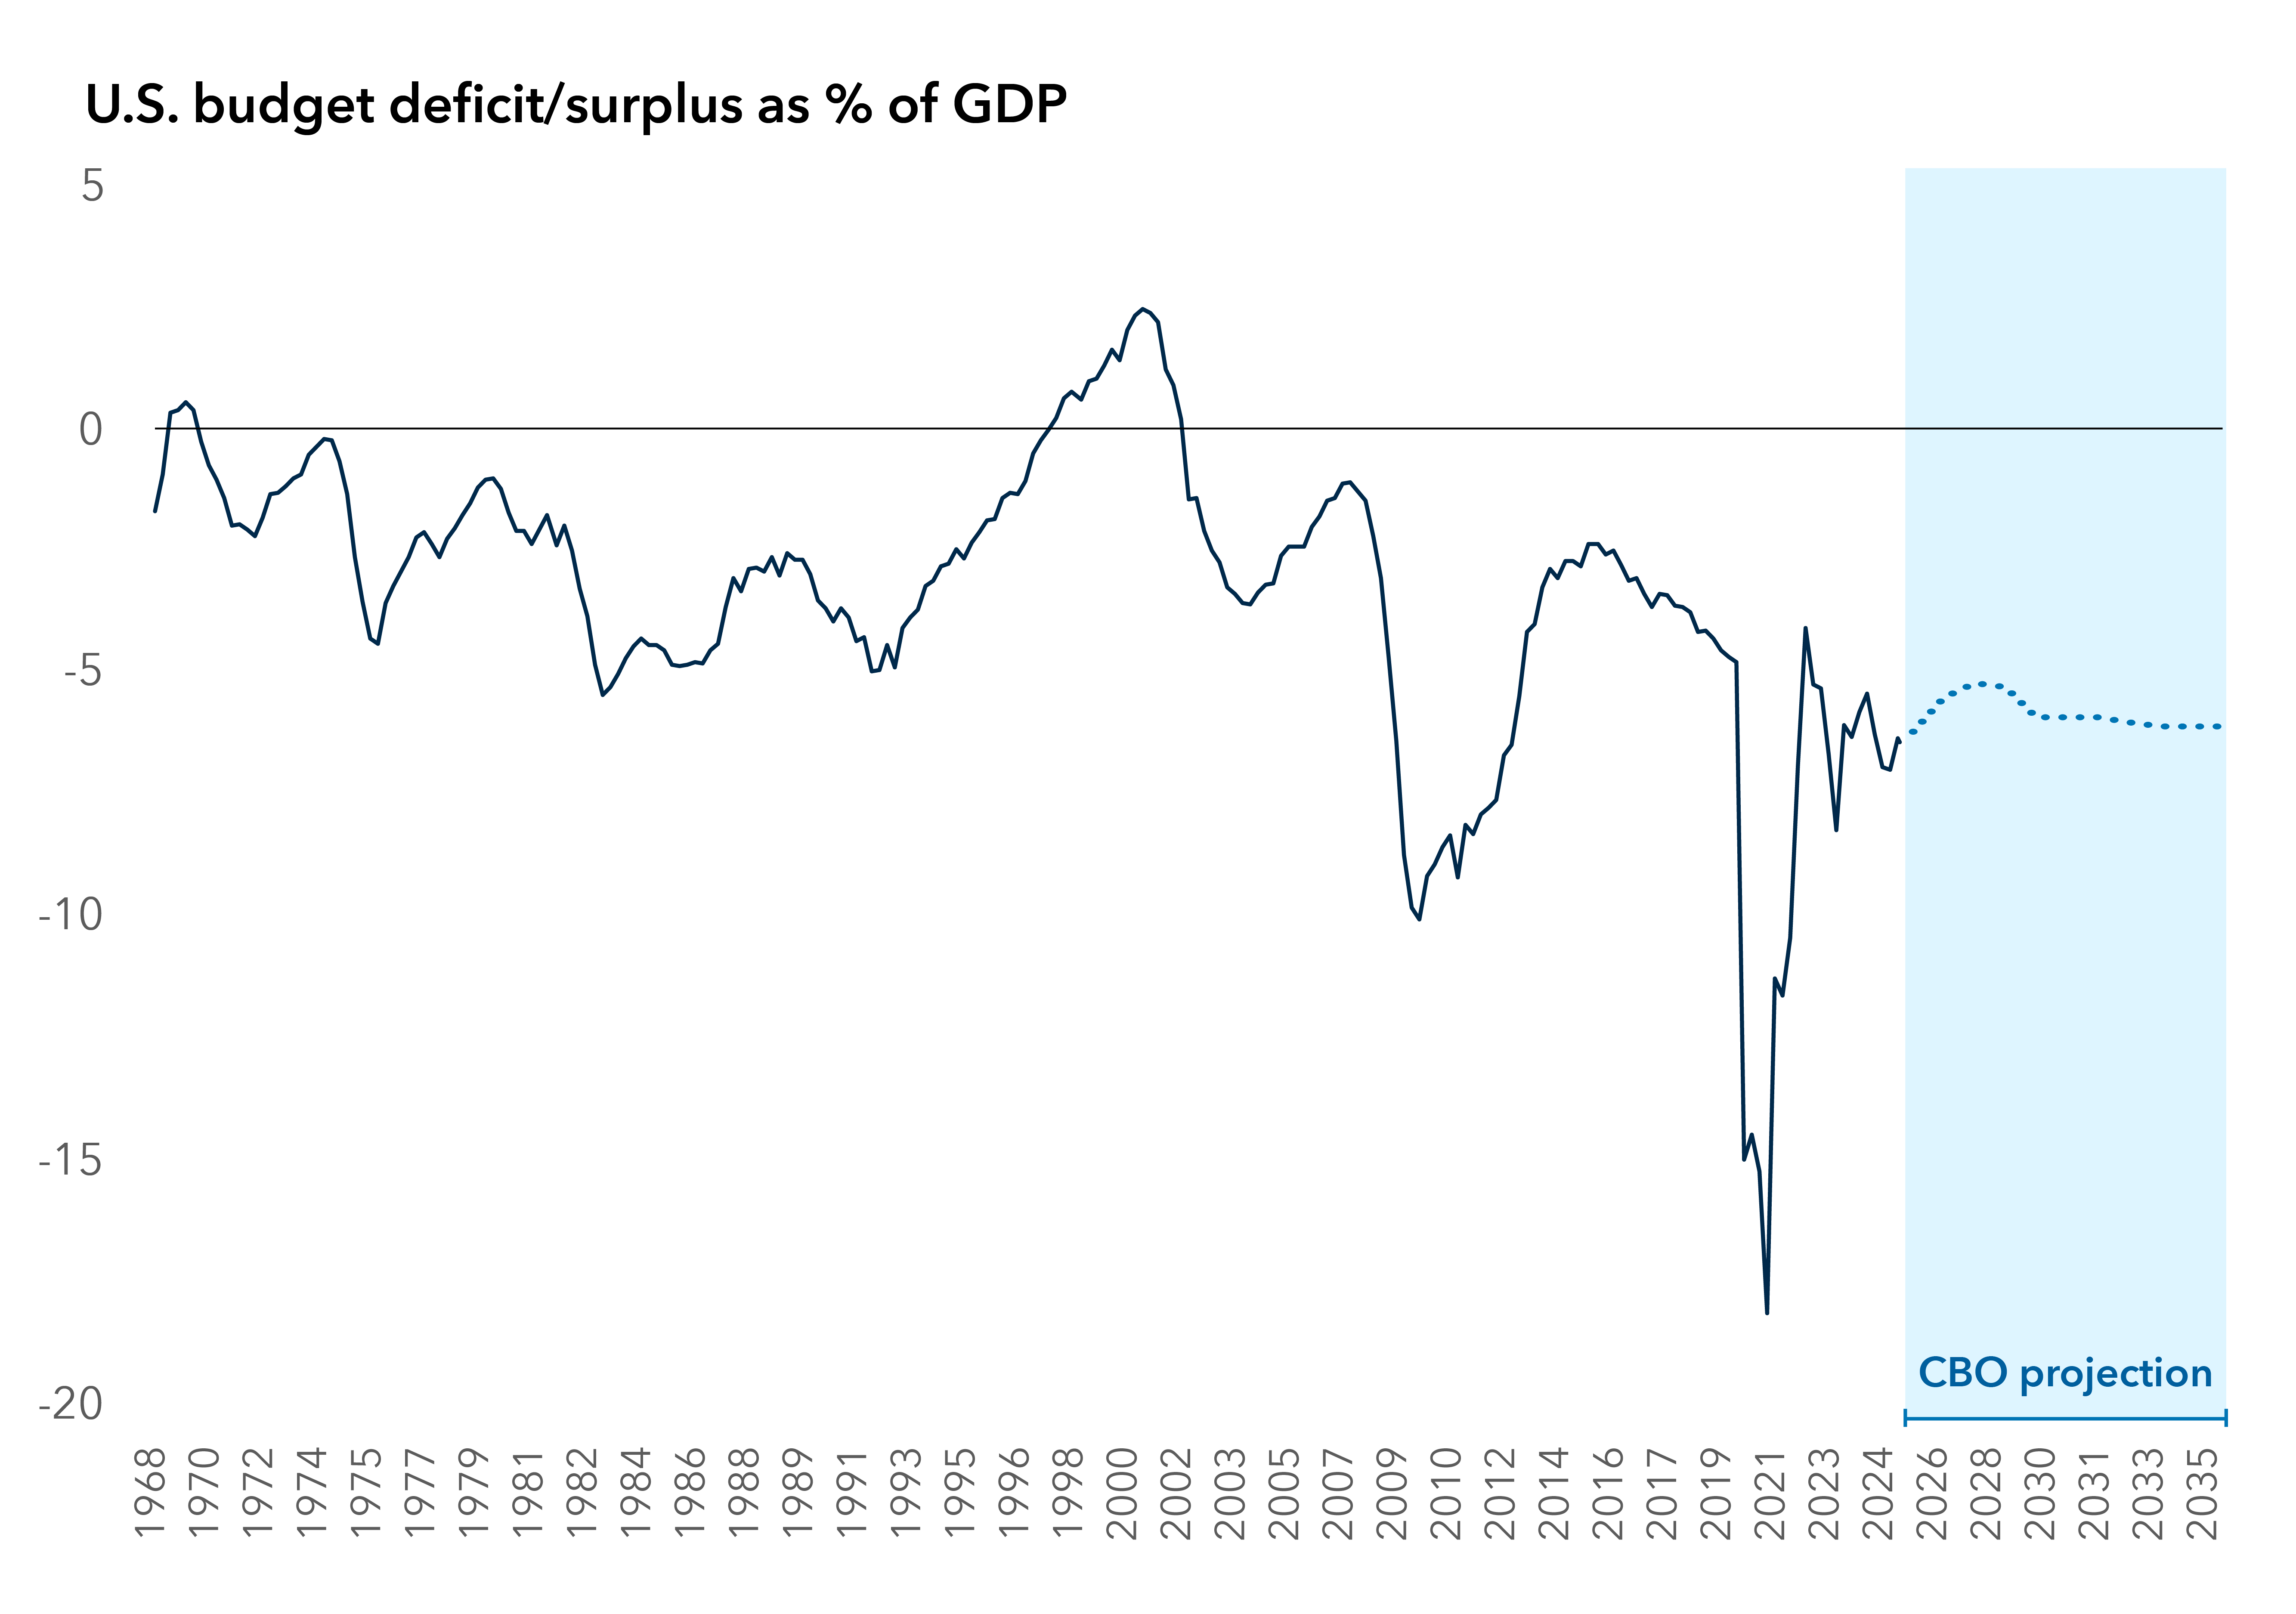
Sources: U.S. Treasury. U.S. Congressional Budget Office (CBO). Data as of 7/31/25.
Until recently, the U.S. interest burden has remained subdued, despite the deficit, as the ballooning debt stock has been offset by low interest rates. However, the interest burden has begun increasing as interest rates have risen closer to long-term historical levels. Some projections suggest that, by 2050, interest payments on federal debt could double as a share of GDP and take up more than a third of government revenue. While there’s hope that economic growth will outpace real interest rates, this is highly uncertain. If growth fails to stay ahead of interest rates, the debt situation could deteriorate rapidly. When the interest burden exceeds nominal growth, this means that debt would be unsustainable even if governments run balanced budgets.
U.S. interest costs approach unsustainable levels
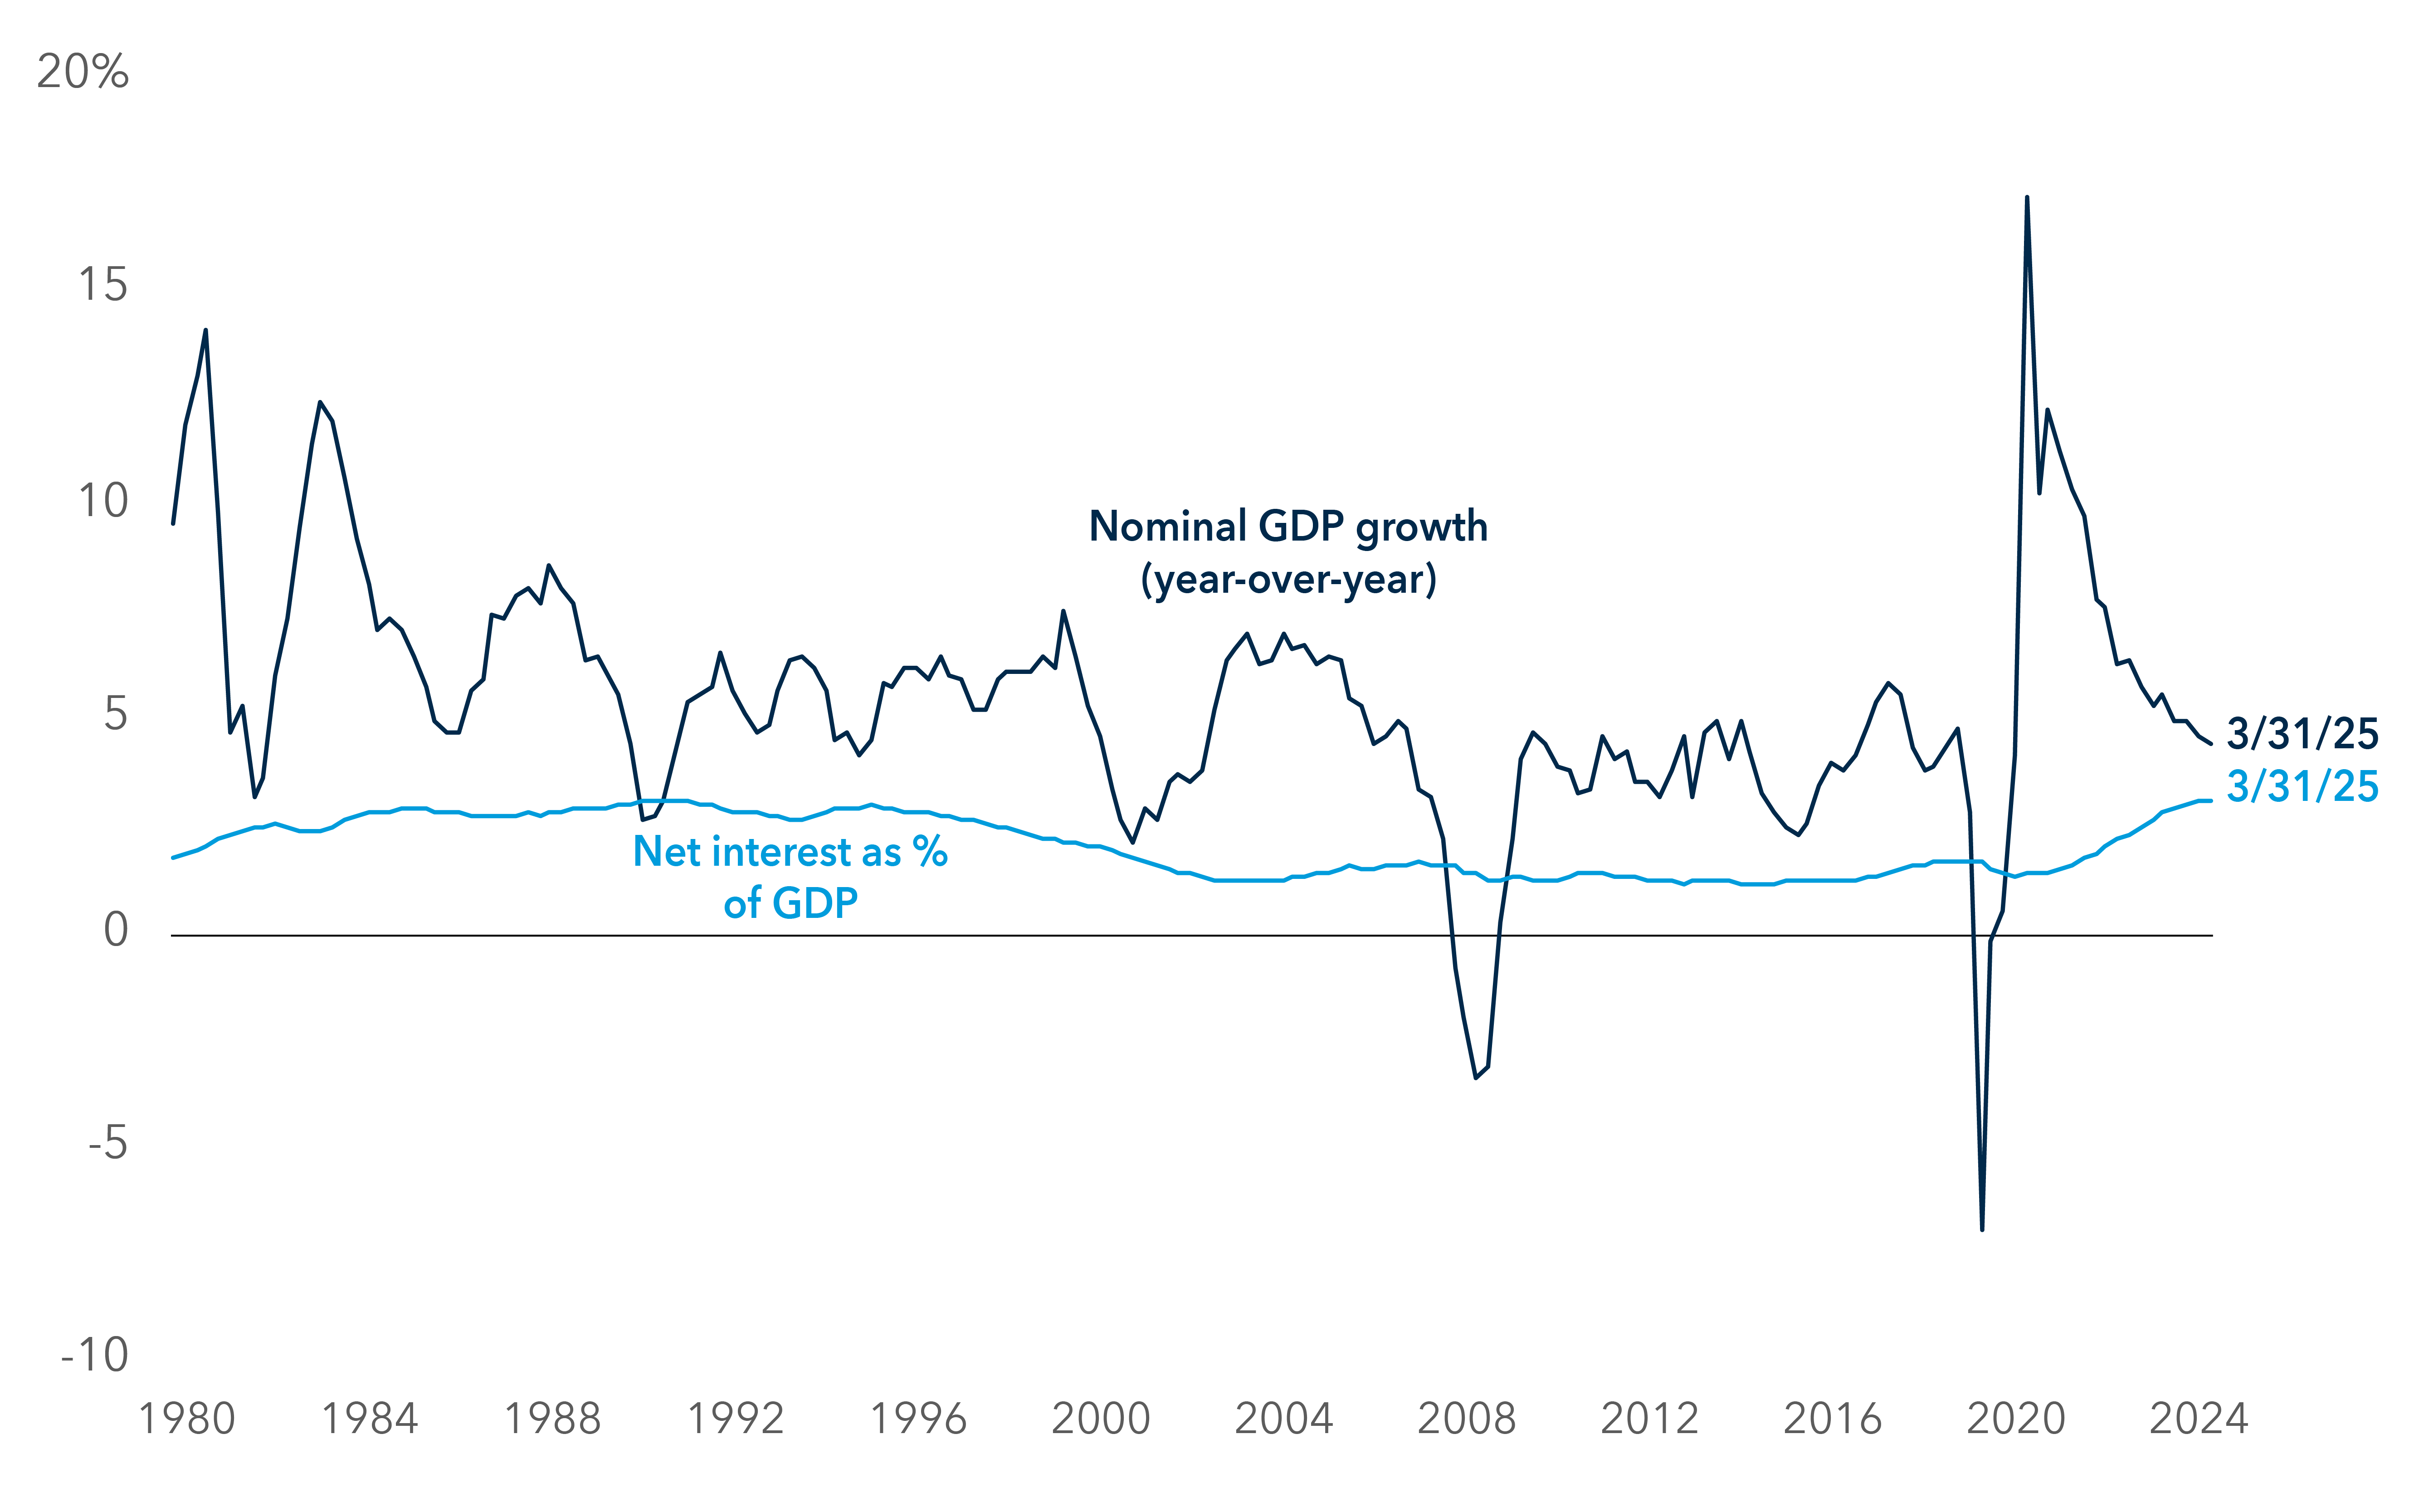
Source: U.S. Bureau of Economic Analysis. Data as of 8/21/25.
Historically, Treasury yields have rarely gone above the interest burden as a percentage of GDP. If interest rates settle modestly below the economic growth rate, that could leave 10-year U.S. Treasuries below 4.5%, absent a large upshift in growth or inflation, although a more significant shock to rates may not be out of the question.
That said, a crisis sparked by mass flight from Treasuries seems unlikely. The U.S. government’s ability to issue debt exclusively in its own currency and see predictable demand from investors who utilize Treasuries as the predominant safe asset of the world provides a unique level of flexibility. Outside of Treasuries, the investable universe of large, liquid, relatively safe and convertible debt is small.
The U.S. dollar dominates global fixed income markets
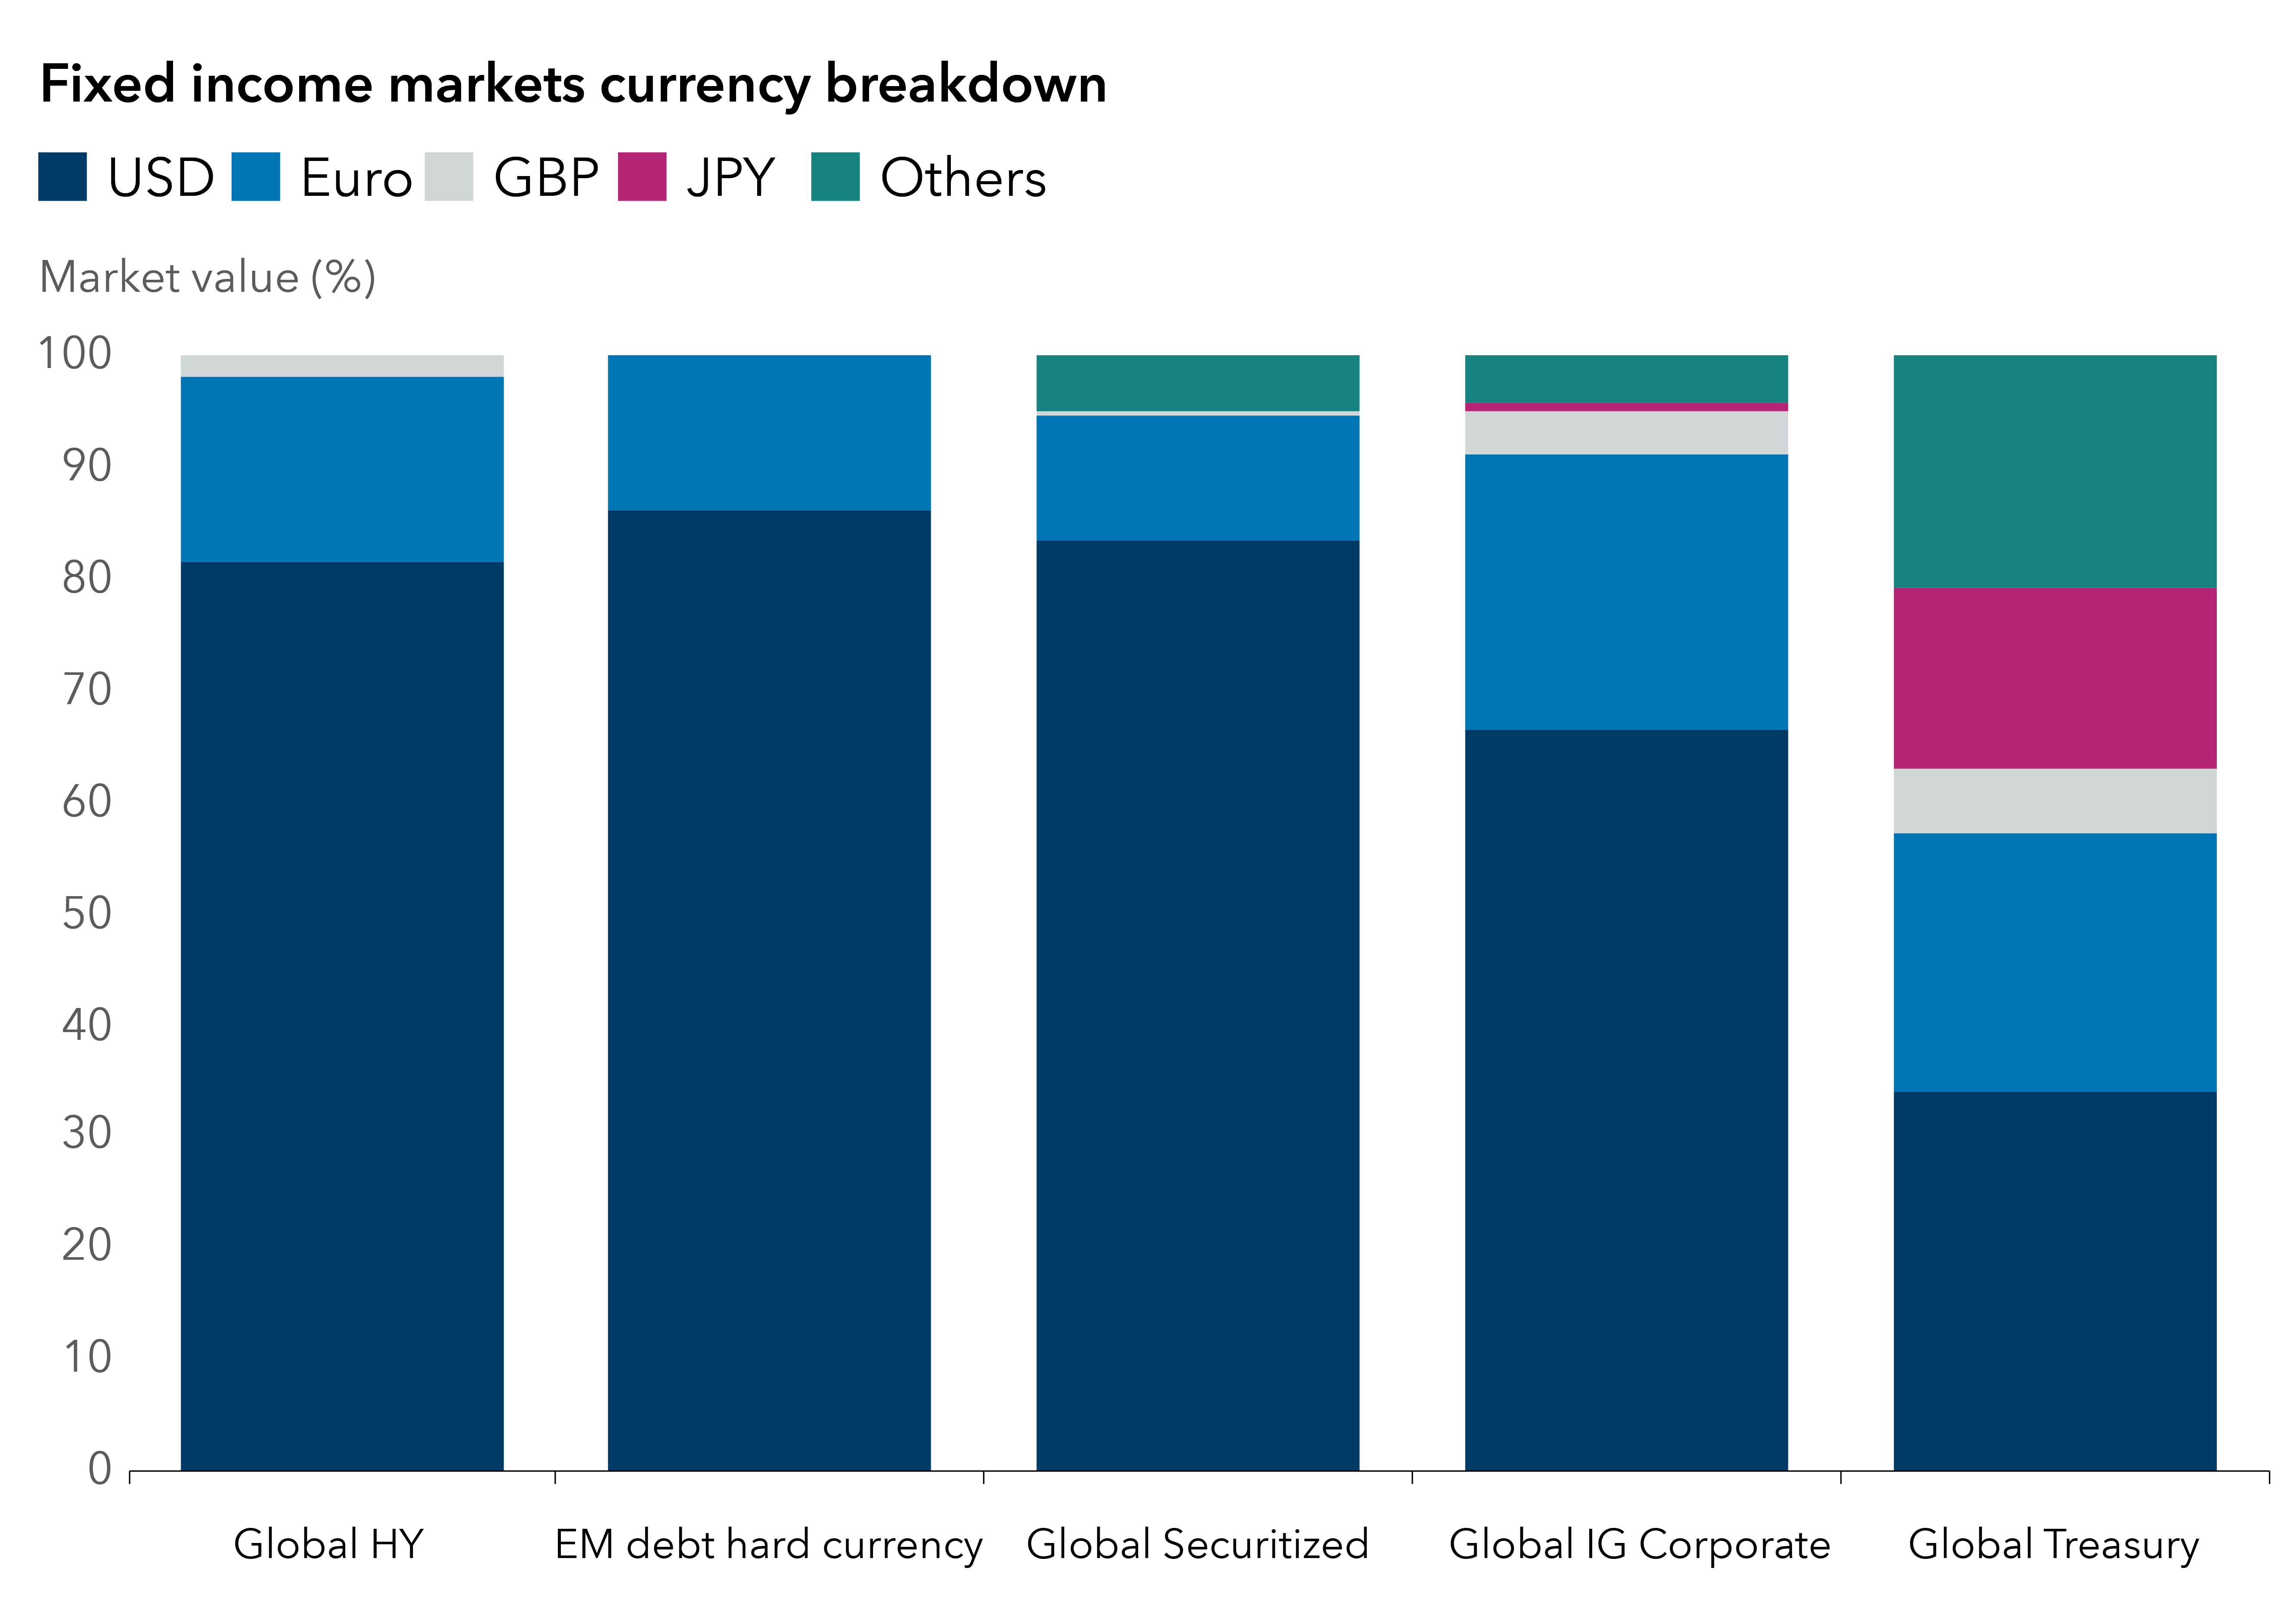
Source: Bloomberg. 5/31/25. USD = U.S. dollar, GBP = British pound, JPY = Japanese yen. Global high yield (HY) = Bloomberg Global High Yield Corporate Index, emerging markets (EM) debt hard currency = Bloomberg EM Hard Currency Aggregate Index, Global Securitized = Bloomberg Global Aggregate Securitized index, Global Investment Grade (IG) Corporate = Bloomberg Global Aggregate Corporate Index, Global Treasury = Bloomberg Global Treasury Index. Others = all other currencies of issuance excluding USD, EUR, GBP and JPY.
If the U.S. debt becomes unsustainable, how can it get back on track?
To reverse a rise in the debt-to-GDP ratio, one of four things would need to occur:
- Higher inflation
- Financial repression
- Austerity
- Higher growth
1. Higher inflation
If the Federal Reserve allows inflation to run above its 2% target, it could help reduce the debt burden, but this path seems unlikely to solve the problem over the long term. Higher inflation is difficult to maintain politically. Once inflation expectations adjust upward, there would only be a short window to inflate away the debt before interest rates would need to rise to ensure price stability.
In this scenario, the U.S. dollar would be expected to weaken, which would further increase inflation (mainly through higher import prices) and potentially boost exports and economic growth. However, there is a potential limit to how much this may help drive down the debt, as the falling value of the dollar may eventually dent investor confidence in the U.S. and could, at some point, threaten its reserve currency status.
While the context and situations differ sharply from the U.S., Italy allowed for high inflation as a tool to manage its debt after World War II until it joined the euro. The result was currency depreciation, investor flight and stagflation, which led to poor living standards and rising unemployment.
2. Financial repression
Financial repression with some combination of implicit yield pegs and debt monetization could be the most likely scenario. The goal would be to keep nominal 10-year yields below nominal growth for an extended period. But this likely only works if inflation expectations remain low, such as in Japan during its quantitative easing era. If financial repression and large deficits lead to higher inflation, the situation could become untenable.
The Federal Reserve’s ability to maintain stable inflation expectations is crucial. This could be more challenging for the U.S. than it was for Japan. Numerous factors in Japan, such as a higher household savings rate, low wages and a declining population, helped keep consumer demand and inflation low.
Financial repression implies very negative real yields (due to some form of yield curve control), requiring central banks to swallow up most of the markets, like the Bank of Japan. Such an outcome could lead investors to worry that the Fed has lost its independence, unless the central bank could convince markets that this action was required to maintain financial stability.
The Treasury can also help with financial repression at the margin by adjusting the maturities of the bonds it issues. The market reaction and this scenario’s ultimate success are likely to depend on whether the market believes any commensurate rise in inflation is transitory.
3. Austerity
An implicit acceptance of higher inflation, central bank accommodation and ongoing large deficits may work for a while, but ultimately, fiscal restraint could be the necessary end game. But austerity typically only comes after a shock.
Governments do not tend to run tighter budgets unless the market forces them, and these policies usually only come after the central bank and/or the Treasury tries to step in. As stated above, a crisis in the U.S. does not seem likely, but the markets are already periodically testing governments. We’ve seen extremely large standard deviation moves in bond yields in the U.K. and France that forced governments to address debt sustainability. And yields can greatly overshoot a sustainable level before action is taken.
If it comes to this point, austerity would be particularly complicated for the U.S. to implement. Government spending is dominated by Medicare, Social Security and defence, and there appears to be little bipartisan appetite for spending cuts in these areas.
Medicare, Social Security and defence make up bulk of U.S. spending

Source: U.S. Bureau of the Fiscal Service. Data as of 8/21/25. “Everything else” includes: health, income security, general government, veterans’ benefits and services, transportation, education, training, employment and social services, natural resources and environment, commerce and housing credit, community and regional development, administration of justice, energy, agriculture, international affairs, general science, space and technology and other unreported data.
4. Higher growth
The least painful way to escape the problem would be through accelerated growth and lower inflation. This may seem unlikely, as real rates have been on a structural uptrend and it could take some time for growth to accelerate enough to keep pace. But over the longer term, there could be cause for hope.
Significant non-inflationary productivity benefits from AI and robotics could take shape with the U.S. potentially leading. If generative AI succeeds, even moderately, nominal GDP growth could rise above CBO projections. Over a decade, this compound growth difference could materially reduce debt-to-GDP ratios.
Federal debt could drop in an optimistic scenario
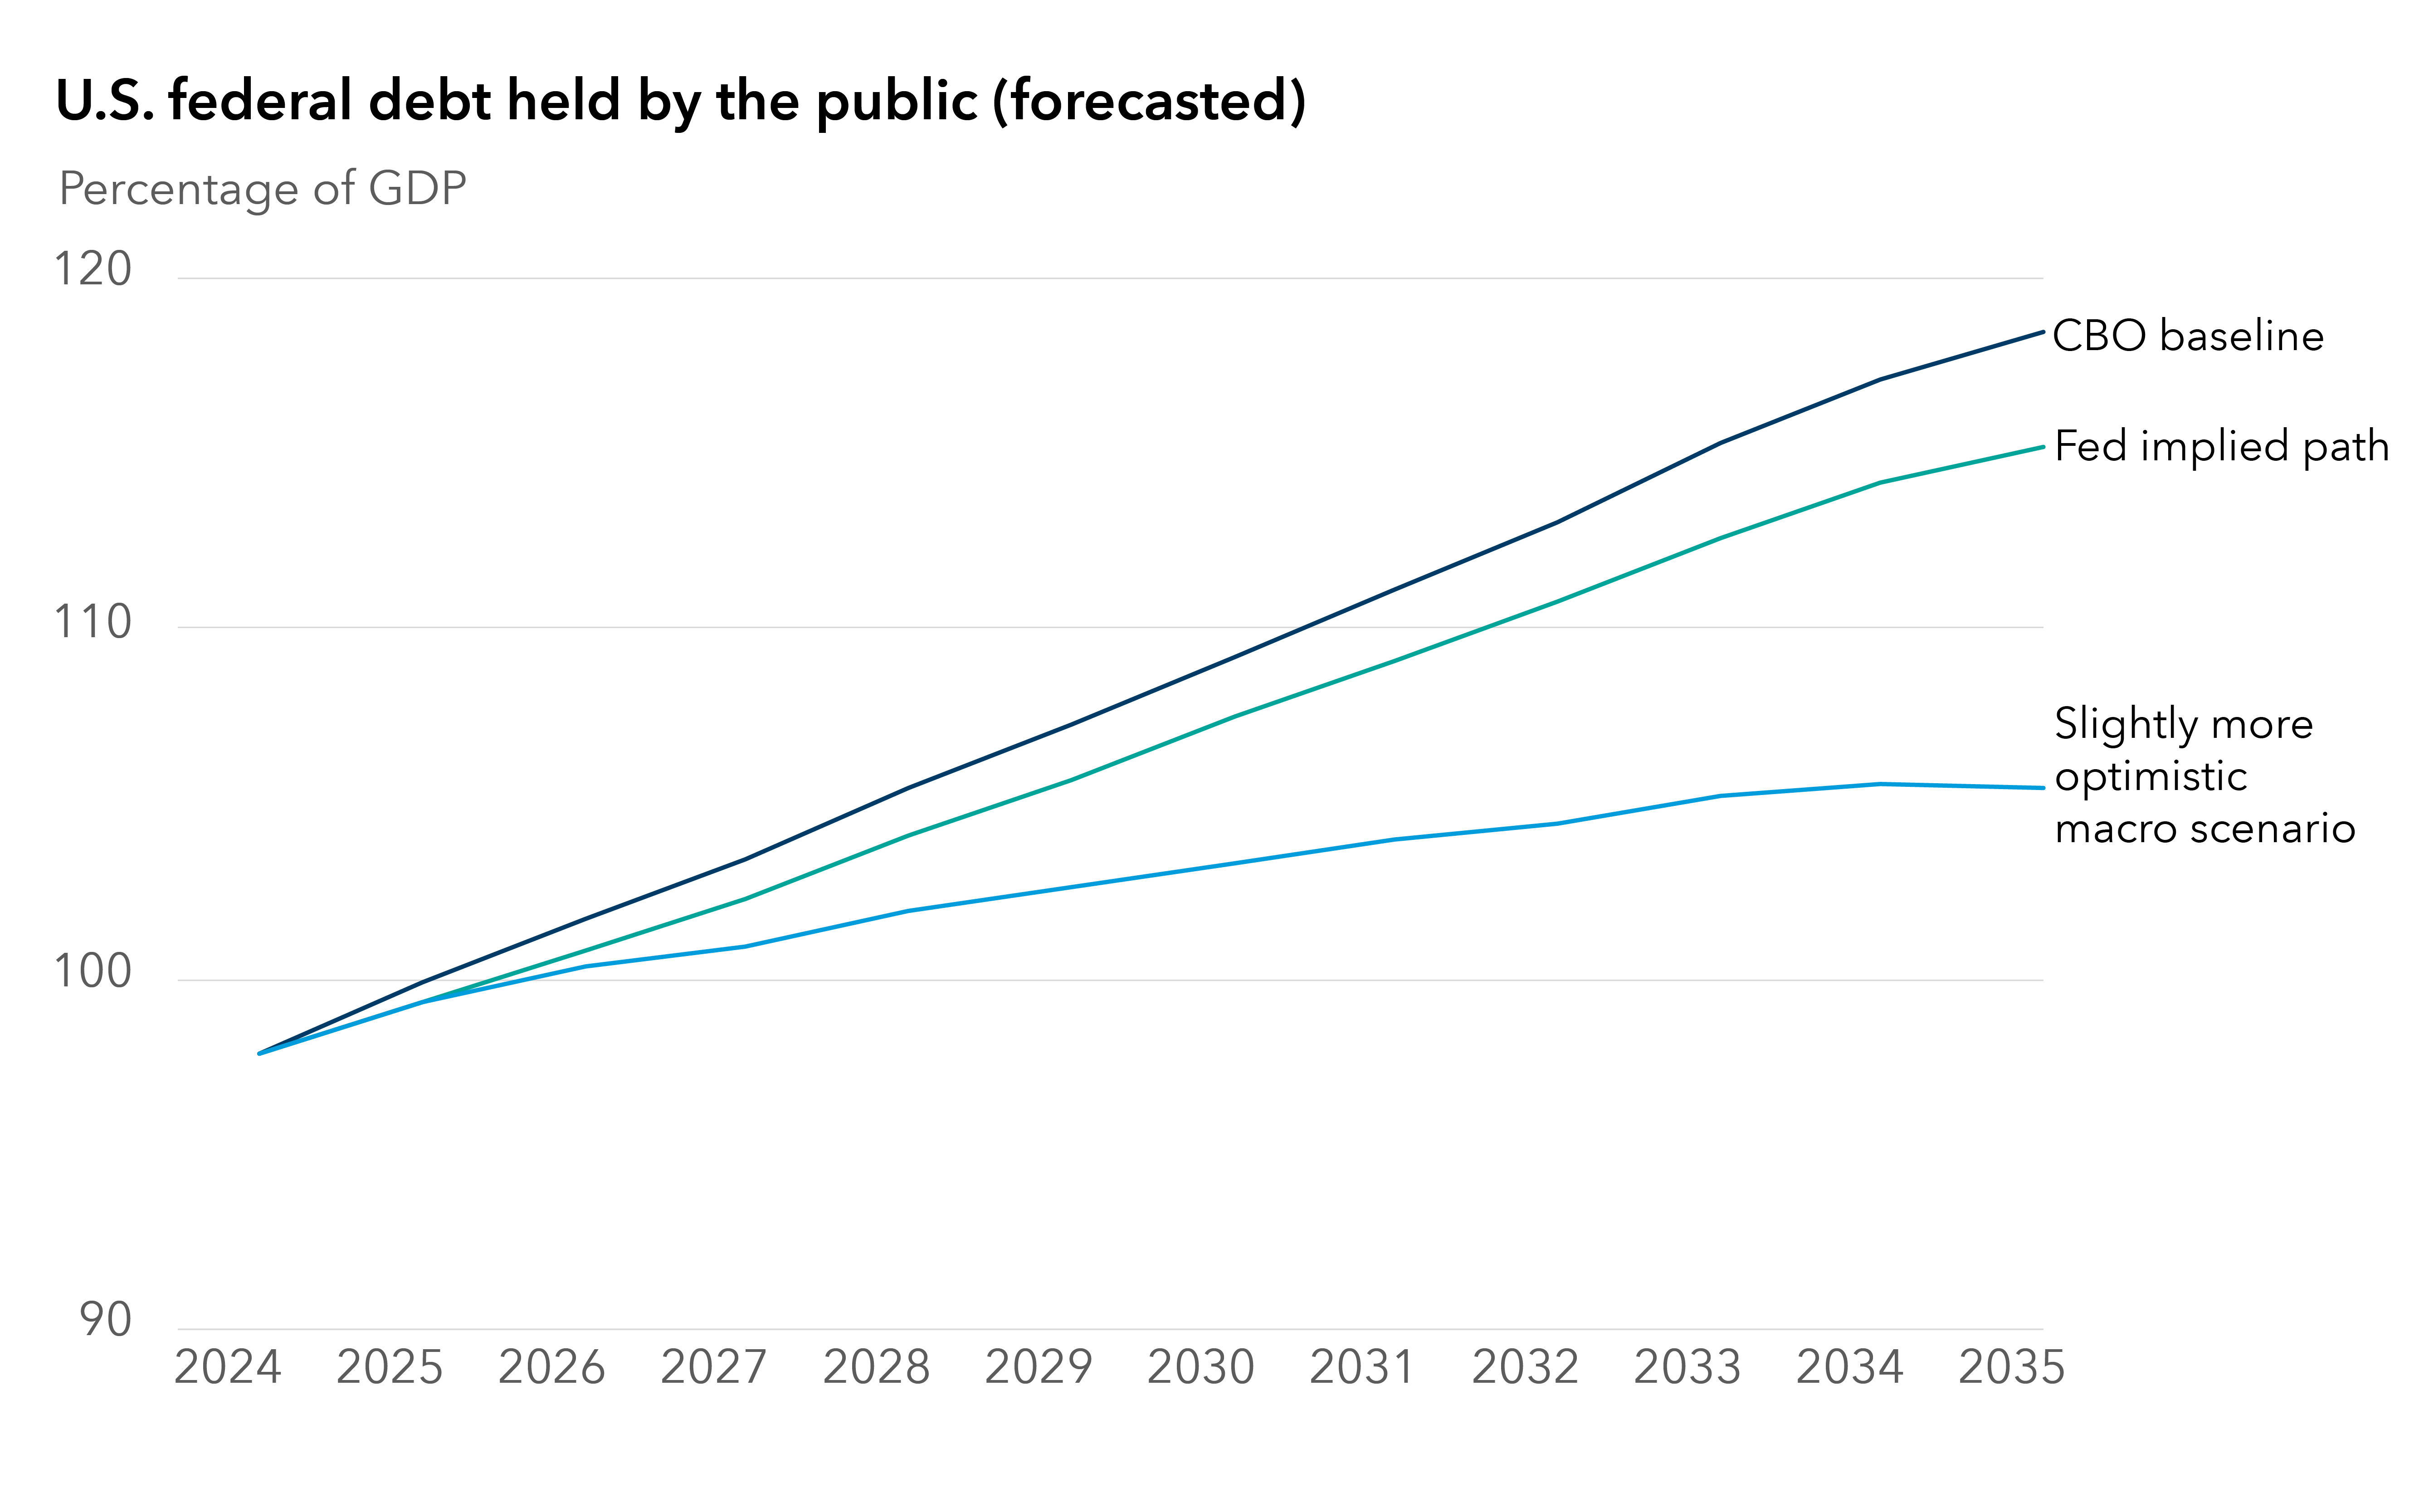
Sources: Capital Group, Capital Strategy Research, U.S. Congressional Budget Office, U.S. Federal Reserve. Data as of June 2025. More optimistic scenario = 0.5% higher inflation, 0.5% higher productivity, 100 basis points (bps) lower 10-year U.S. Treasury yield than CBO baseline.
If the U.S. maintains or widens its tech leadership, its debt outlook should improve relative to others. If the productivity gap between the U.S. and other countries holds or expands, relative debt burdens would be less concerning. Technological change may also be disinflationary. Historically, major technologies (e.g., electricity, semiconductors) have reduced costs and prices. AI may exert similar downward pressure on inflation.
That said, if generative AI disappoints or has setbacks, it may also be beneficial for bonds, assuming the U.S. continues to be the global reserve currency and safe-haven asset. If yields fall, it could allow the U.S. to lower its debt burden and potentially extend out maturities again.
Where do we go from here?
A large increase in the risk premium on U.S. Treasuries seems unlikely, but debt sustainability continues to matter. If the issue comes to a head, inflation and financial repression would likely follow, and austerity could ultimately be the only way out. This all speaks to a higher term premium on Treasuries and/or a weaker U.S. dollar until austerity becomes a real possibility.
That said, there is still reason for optimism. Long-term debt sustainability is fundamentally a function of future GDP growth, not just current deficits. Technological change — particularly from generative AI — could be a primary driver and determinant of growth and thus fiscal sustainability. If generative AI succeeds and the U.S. leads the way, it may be able to keep its head above water.
Learn more about
Bloomberg Global High Yield Corporate Index is a multi-currency flagship measure of the global high-yield debt market. The index represents the union of the U.S. High Yield, the Pan-European High Yield and Emerging Markets (EM) Hard Currency High Yield Indices. The high-yield and emerging markets sub-components are mutually exclusive.
Bloomberg Emerging Markets Hard Currency Aggregate Index is a flagship hard currency Emerging Markets debt benchmark that includes USD, EUR and GBP-denominated debt from sovereign, quasi-sovereign and corporate EM issuers.
The Bloomberg Global Securitized Aggregate Index tracks securitized bonds from the flagship Global Aggregate Index.
The Bloomberg Global Aggregate Corporate Index is a flagship measure of global investment-grade, fixed-rate corporate debt. This multi-currency benchmark includes bonds from developed and emerging markets issuers within the industrial, utility and financial sectors.
The Bloomberg Global Treasury Index tracks fixed-rate, local currency government debt of investment-grade countries, including both developed and emerging markets. The index represents the treasury sector of the Global Aggregate Index and contains issues from 37 countries denominated in 24 currencies.
Our latest insights
-
-
Markets & Economy
-
Asset Allocation
-
-
Artificial Intelligence
RELATED INSIGHTS
-
Asset Allocation
-
Global Equities
-
Markets & Economy
Commissions, trailing commissions, management fees and expenses all may be associated with investments in investment funds. Please read the prospectus before investing. Investment funds are not guaranteed or covered by the Canada Deposit Insurance Corporation or by any other government deposit insurer. For investment funds other than money market funds, their values change frequently. For money market funds, there can be no assurances that the fund will be able to maintain its net asset value per security at a constant amount or that the full amount of your investment in the fund will be returned to you. Past performance may not be repeated.
Unless otherwise indicated, the investment professionals featured do not manage Capital Group‘s Canadian investment funds.
References to particular companies or securities, if any, are included for informational or illustrative purposes only and should not be considered as an endorsement by Capital Group. Views expressed regarding a particular company, security, industry or market sector should not be considered an indication of trading intent of any investment funds or current holdings of any investment funds. These views should not be considered as investment advice nor should they be considered a recommendation to buy or sell.
Statements attributed to an individual represent the opinions of that individual as of the date published and do not necessarily reflect the opinions of Capital Group or its affiliates. This information is intended to highlight issues and not be comprehensive or to provide advice. For informational purposes only; not intended to provide tax, legal or financial advice. Capital Group funds are available in Canada through registered dealers. For more information, please consult your financial and tax advisors for your individual situation.
Forward-looking statements are not guarantees of future performance, and actual events and results could differ materially from those expressed or implied in any forward-looking statements made herein. We encourage you to consider these and other factors carefully before making any investment decisions and we urge you to avoid placing undue reliance on forward-looking statements.
The S&P 500 Composite Index (“Index”) is a product of S&P Dow Jones Indices LLC and/or its affiliates and has been licensed for use by Capital Group. Copyright © 2026 S&P Dow Jones Indices LLC, a division of S&P Global, and/or its affiliates. All rights reserved. Redistribution or reproduction in whole or in part are prohibited without written permission of S&P Dow Jones Indices LLC.
FTSE source: London Stock Exchange Group plc and its group undertakings (collectively, the "LSE Group"). © LSE Group 2026. FTSE Russell is a trading name of certain of the LSE Group companies. "FTSE®" is a trade mark of the relevant LSE Group companies and is used by any other LSE Group company under licence. All rights in the FTSE Russell indices or data vest in the relevant LSE Group company which owns the index or the data. Neither LSE Group nor its licensors accept any liability for any errors or omissions in the indices or data and no party may rely on any indices or data contained in this communication. No further distribution of data from the LSE Group is permitted without the relevant LSE Group company's express written consent. The LSE Group does not promote, sponsor or endorse the content of this communication. The index is unmanaged and cannot be invested in directly.
BLOOMBERG® is a trademark and service mark of Bloomberg Finance L.P. and its affiliates (collectively “Bloomberg”). Bloomberg or Bloomberg’s licensors own all proprietary rights in the Bloomberg Indices. Neither Bloomberg nor Bloomberg’s licensors approves or endorses this material, or guarantees the accuracy or completeness of any information herein, or makes any warranty, express or implied, as to the results to be obtained therefrom and, to the maximum extent allowed by law, neither shall have any liability or responsibility for injury or damages arising in connection therewith.
The MSCI information may only be used for your internal use, may not be reproduced or redisseminated in any form and may not be used as a basis for or a component of any financial instruments or products or indices. None of the MSCI information is intended to constitute investment advice or a recommendation to make (or refrain from making) any kind of investment decision and may not be relied on as such. Historical data and analysis should not be taken as an indication or guarantee of any future performance analysis, forecast or prediction. The MSCI information is provided on an “as is” basis and the user of this information assumes the entire risk of any use made of this information. MSCI, each of its affiliates and each other person involved in or related to compiling, computing or creating any MSCI information (collectively, the “MSCI Parties”) expressly disclaims all warranties (including, without limitation, any warranties of originality, accuracy, completeness, timeliness, non-infringement, merchantability and fitness for a particular purpose) with respect to this information. Without limiting any of the foregoing, in no event shall any MSCI Party have any liability for any direct, indirect, special, incidental, punitive, consequential (including, without limitation, lost profits) or any other damages. (www.msci.com)
Capital believes the software and information from FactSet to be reliable. However, Capital cannot be responsible for inaccuracies, incomplete information or updating of the information furnished by FactSet. The information provided in this report is meant to give you an approximate account of the fund/manager's characteristics for the specified date. This information is not indicative of future Capital investment decisions and is not used as part of our investment decision-making process.
Indices are unmanaged and cannot be invested in directly. Returns represent past performance, are not a guarantee of future performance, and are not indicative of any specific investment.
All Capital Group trademarks are owned by The Capital Group Companies, Inc. or an affiliated company in Canada, the U.S. and other countries. All other company names mentioned are the property of their respective companies.
Capital Group funds are offered in Canada by Capital International Asset Management (Canada), Inc., part of Capital Group, a global investment management firm originating in Los Angeles, California in 1931. Capital Group manages equity assets through three investment groups. These groups make investment and proxy voting decisions independently. Fixed income investment professionals provide fixed income research and investment management across the Capital organization; however, for securities with equity characteristics, they act solely on behalf of one of the three equity investment groups.
The Capital Group funds offered on this website are available only to Canadian residents.