
Global Equities
Trade
Making sense of tariffs
 Jared Franz
 Robert Lind
May 9, 2025
For most of us, the word “tariff” conjures vague memories of high school history class. We remember something about the Smoot-Hawley Tariff Act of 1930, the Great Depression and the dark side of protectionist trade policy. Fast forward to today and tariffs are once again on center stage, serving as the linchpin of President Trump’s trade policy — and causing market volatility.
Headlines that would have beggared belief just a few months ago have become de rigueur, from reciprocal tariffs towering above 100% to earnest speculation that China-U.S. trade could be over. The scale and breadth of the changes appear to have outpaced the market’s ability to keep up, let alone offered enough space for nuanced discussion. Accordingly, a fierce debate has emerged over the impact they could have on the global economy.
Critics argue that the tariff campaign marks the start of a trade war that will hurt all countries. Supporters say it’s an attempt by the U.S. to reduce longstanding trade deficits and compel other countries to lower their own protectionist measures.
In either case, the rewiring of global trade reflects a larger shift in the geopolitical world order that is, in our view, just beginning.
Decoding tariffs: Motivations and implications
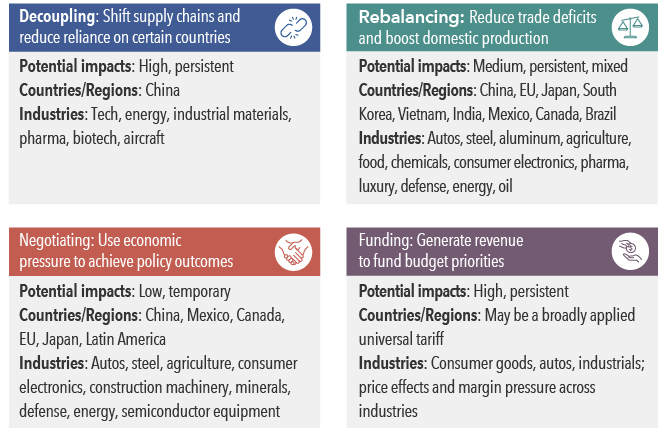
Sources: Capital Group, American Compass. As of March 5, 2025.
We are following the events closely, analyzing how various tariff-related scenarios could play out, and in what way, if at all, they may change our big-picture outlook on the markets and the economy. We’re also cognizant of the fact that — as one of our colleagues noted — sometimes you have to look beyond historical models. The standard formulas for analyzing the global economy are based on 40 years of data where the direction was uniformly toward greater cross-border integration rather than less. Inflation was low. Add in today’s high level of uncertainty and you have an environment where historical analogies must be viewed with caution.
To help make sense of it all, we developed this guide to tariffs and their potential implications for the economy, markets and investors.
What are tariffs and how are they used?
Tariffs are essentially taxes on goods imported from other countries. They are used to help protect domestic producers from foreign competition, among other purposes.
We employ a four-box framework to understand the motivations for tariffs and what they could mean for the investment environment. Four main factors — decoupling, rebalancing, negotiating and funding — will influence how the story plays out. For instance, tariffs used for negotiating purposes are unlikely to persist over long periods of time while those that are part of a larger decoupling process could be here to stay.
Our base case is that the United States can weather changes to trade policies, though higher tariffs would likely dampen economic activity and raise import prices. The U.S. has the advantages of size, economic resilience and consumers with money to spend. Businesses have also ramped up investments in the U.S., both domestically and abroad from companies eager to maintain access to the world’s largest economy.
The U.S. trade deficit surged to near record highs in 2024
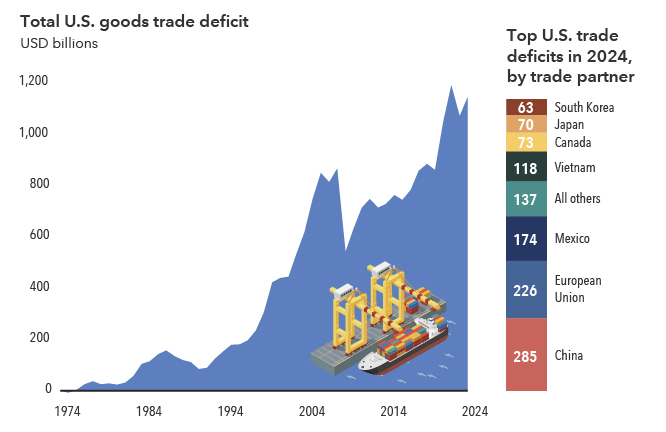
Sources: Capital Group, Bureau of Economic Analysis. Figures reflect 12-month totals through September of each year. As of September 30, 2024.
However, the ambiguity caused by shifting trade policies is already affecting business and consumer confidence, with potential negative consequences for the U.S. economy and markets.
The fallout for other countries also remains uncertain, particularly those that rely heavily on the U.S. for trade, such as Mexico and Canada, where exports to the U.S. account for around 20% to 25% of GDP. For most European economies, exports to the U.S. make up approximately 2% to 3% of their GDP. If the U.S. imposes tariffs, resulting in lower exports and economic growth for these countries, then those countries may have more incentive to loosen their macroeconomic policy to counter the negative effects. Some governments are responding decisively. Germany, for example, has relaxed its fiscal policy dramatically and laid out plans to increase spending for infrastructure and defense, in part to reduce reliance on exports for growth.
Why is the U.S. trade deficit so high?
If there’s one number to know about tariffs, it’s the U.S. trade deficit for goods. That figure hit $1.1 trillion in 2024 as Americans bought imported products and a strong U.S. dollar weighed on exports. The U.S. has run a trade deficit every year since the 1970s.
Economists note the high trade deficit may be a sign of economic strength — indicating U.S. consumers are buying — but the figure is nonetheless why tariffs are central to Trump’s economic agenda. Other countries rely on global trade far more than the United States, and the administration aims to leverage the U.S.’s economic position to achieve a more balanced relationship with its trading partners.
Still, the U.S. runs the world’s largest current account deficit, which is the counterpart of huge foreign capital inflows into the U.S. If the U.S. wants to reduce its deficit, it will likely mean smaller capital inflows and a weaker dollar.
Trump’s novel use of emergency orders to implement or remove tariffs has unnerved markets. Prior administrations have used tariffs to varying degrees, but under laws that required detailed analysis, which allowed more time for companies and stakeholders to respond. Whatever the method, tariffs may represent a pivot to an isolationist-leaning policy that could have long-term ramifications for investment portfolios.
Home appliance prices rose then stabilized under Trump
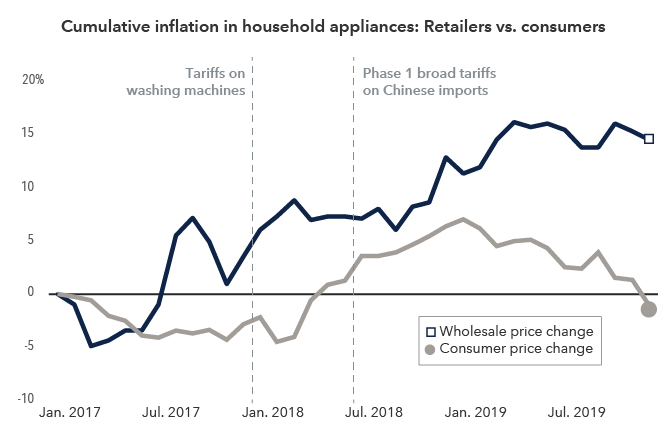
Sources: Capital Group, Bureau of Labor Statistics, Peterson Institute for International Economics. Retailer price change is represented by the Producer Price Index (PPI) retail trade for the major appliances subcategory. The PPI measures the average change over time in the selling prices received by domestic producers for their output. Consumer price change is represented by the Consumer Price Index for major appliances subcategory. As of December 15, 2019.
Do tariffs cause inflation?
The short answer is yes, but how it plays out is more complex.
In the event of a one-time tariff, prices would likely increase modestly but even out over time. A more worrisome development is a trade war scenario, where tariffs ratchet up year to year. That, in turn, could lead to higher long-term inflation with a knock-on effect of rising interest rates.
Economists agree the cost of tariffs is largely paid for by a combination of consumers and companies willing to accept lower profit margins. A common estimate is that 30% to 50% of the cost is passed on to consumers, though the rate may be higher for products with fewer substitutes. Recent research has shown that the 2018–2019 tariffs were mostly passed on to U.S. consumers.
Trump’s decision to impose tariffs on imported washing machines, but not dryers, in January 2018 is an often-cited case study from economists at the University of Chicago and the Federal Reserve. The study found domestic U.S. manufacturers raised prices to match competitors, despite not being tariffed. Moreover, prices of dryers also increased as manufacturers may have used tariffs to raise prices opportunistically or split the increases between the washers and dryers.
What is trade reciprocity and how will it unfold?
At face value, the concept of trade reciprocity is simple: We charge you the same tariffs that you charge us.
The Trump administration aims to rebalance tariffs between the U.S. and other countries to make them reciprocal. Such a move bucks 75 years of multilateral U.S. trade policy and sidesteps rules of the World Trade Organization, the successor to the General Agreement on Tariffs and Trade of 1947.
This change in strategy is happening because the U.S. administration believes the balance has tipped too far as key American industries face steep barriers to selling their products abroad. Take cars, for example. Auto sales between the U.S. and the European Union favor the latter. The EU currently imposes a 10% tariff on U.S. cars sold in their markets compared to the 2.5% rate that the U.S. imposes on imported European autos.
Trump has railed against value-added tax (VAT) rates, which are charged by many countries on domestic purchases, as a justification for his reciprocal tariffs. These rates are generally applied at each stage of production, versus a US sales tax which is levied at the final sale. Although it’s unclear exactly which tariffs will take effect after the 90-day pause, the tariffs announced on “Liberation Day” in early April were higher than expected, in part to counter VATs.
Given the one-on-one nature of these trade negotiations, details matter. Tariffs on major trading partners such as China, the EU, Canada and Mexico can reduce U.S. trade deficits and boost domestic production by giving local businesses an edge over imports.
Tariffs dominated headlines during Trump’s first term
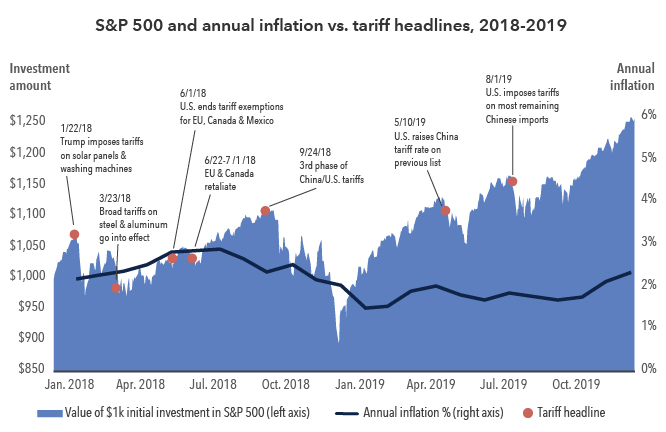
Sources: Capital Group, Bureau of Labor Statistics, Peterson Institute for International Economics, Standard & Poor's. Value of a hypothetical investment in the S&P 500 reflects the total return of the index over the period from January 1, 2018, to December 31, 2019. Past results are not predictive of future performance. The index is unmanaged and, therefore, has no expenses. Investors cannot invest directly in an index.
They could also invite retaliation, such as China’s own escalating series of broad tariffs on the U.S. After Trump announced 145% duties on Chinese goods, Beijing responded by increasing its import taxes to 125%. The unprecedented jump in the cost of trade prompted several market watchers to question if the two countries can even have a commercial relationship under current conditions. Smaller-scale retaliation has occurred, too: for example, Canada removed U.S. liquor from its shelves.
What impact did tariffs have during the first Trump administration?
Investors may be experiencing a strong sense of déjà vu as tariffs make headlines. The first Trump administration pursued a similar goal of reducing the trade deficit by imposing tariffs on China. That move sparked a trade war that whipsawed markets and dominated the news, much like now.
In hindsight, the impact on inflation was muted in the aggregate, with the annual increase in the consumer price index ranging from 1.50% to 2.85% in 2018 and 2019. The S&P 500 declined in 2018 but rallied sharply in 2019, both years driven by factors other than tariffs.
The world has changed since the initial round of tariffs. The impacts of the pandemic, wars in Ukraine and the Middle East, and the greatest inflation shock in decades continue to ripple through the economy. How tariffs and federal spending cuts will affect growth is even more uncertain given the evolving nature of Trump’s more significant policies.
The lesson may be that in times like these, it’s important to be clear about what we do and don’t know — recognizing that tariffs are just one part of the equation. Focusing on investment principles such as diversification and staying invested in the face of market volatility become more essential to achieving long-term investment goals.
Explore topics
The Consumer Price Index (CPI) is a measure of the average change over time in the prices paid by urban consumers for a market basket of consumer goods and services.
The S&P 500 Index is a market capitalization-weighted index based on the results of approximately 500 widely held common stocks.
The S&P 500 (“Index”) is a product of S&P Dow Jones Indices LLC and/or its affiliates and has been licensed for use by Capital Group. Copyright © 2025 S&P Dow Jones Indices LLC, a division of S&P Global, and/or its affiliates. All rights reserved. Redistribution or reproduction in whole or in part is prohibited without written permission of S&P Dow Jones Indices LLC