
Economic Indicators
Market Volatility
First, market volatility. Then a flourish.
Investors might detest volatility, but it’s hard to argue with the markets’ recent results.
In a remarkable turn, major indices ended the second quarter with double-digit gains despite suffering precipitous drops in the aftermath of the April 2 “liberation day” tariff proclamations. The S&P 500 Index notched a new high with a total return of nearly 11%, while the MSCI EAFE Index climbed almost 12% — blistering rebounds given the speed and magnitude of the preceding selloff.
If that feels unusually dramatic, that’s because it was. The S&P 500 sank almost 19% — just shy of a bear market — before recovering in 79 days. To put that in perspective, a Capital Group survey of markets from 1954 to 2024 showed that it took an average of 256 days, or a little more than eight months, to recover from a plunge of between 15% and 20%. This cycle took place in a single quarter.
Volatility looks likely to remain high in the near term. U.S. trade policy is unsettled, with the ever-present possibility of new tariffs. Tensions remain elevated in the Middle East despite a June ceasefire agreement between Israel and Iran. The Russia-Ukraine war continues to grind on.
But there are also potential opportunities. Germany took steps to borrow more to stimulate its economy, while many NATO members have pledged to spend more on defense.
In the U.S., the economy has continued to surpass expectations. Inflation has remained muted despite fear of potential tariff impacts down the road. Job growth has been solid while the unemployment rate remains low.
Sources of volatility were varied and widespread.
Tariffs were the proximate cause of the April selloff that kicked off the quarter. While the White House had telegraphed its intent to increase trade levies, few anticipated how broad and deep those taxes would be. Concerns over inflation and supply chain disruptions sparked pulse-pounding selloffs in the U.S. and abroad.
Other forces compounded the jitters. The Russia-Ukraine conflict continued with no resolution in sight, and Israel and Iran traded blows in what’s become known as the Twelve-Day War, which included a U.S. strike on Iran’s Fordo uranium-enrichment facility.
However, volatility cuts both ways. Markets reacted instantaneously when the White House delayed many tariffs, including the broad “reciprocal” levies. On April 9, when President Donald Trump announced the decision — partially citing market concerns — the S&P 500 rallied almost 10%, nearly erasing the fall-off that came after “liberation day.” Markets also perked after Iran and Israel announced a ceasefire on June 24.
International stocks could take leadership after trailing the U.S. for more than a decade.
International developments could provide a tailwind moving forward. Germany relaxed its “debt brake,” a constitutional amendment that limited how much the state could borrow, in an effort to revitalize aging infrastructure, better fund its defense and aid domestic industries that have suffered from changes to global trading patterns. German financial institutions have already benefited from an anticipated increase in stimulus spending and corporate loan demand. Similarly, new pledges of increased defense spending by NATO members could benefit aerospace and defense companies.
Historically, U.S. and international stock markets have traded leadership positions every few years. But that pattern hadn’t held for the better part of two decades — average annual U.S. returns handily outpaced international returns from 2008 to 2024, largely driven by outsize growth in a handful of technology stocks.
The narrative could be reversing. In three of the last four quarters, international stocks have beaten their U.S. counterparts. That doesn’t necessarily signal a leadership handoff, but some factors recently favoring non-U.S. companies could have long legs.
Aforementioned government spending stands to boost European economies, as the eurozone is showing signs of growth. One popular measure of business activity points toward sustained growth in the region’s manufacturing sector, which has historically been correlated with expanding eurozone GDP.
Additionally, a falling U.S. dollar could boost international stocks. The dollar has weakened this year amid trade policy uncertainty. It’s too early to determine whether this is a short-term slump or the early phases of something deeper, but periods of U.S. currency weakness have been correlated with European and Asian-Pacific markets, measured by the MSCI EAFE Index, outpacing the U.S. market, represented by the S&P 500.
International stocks outpaced the U.S. in three of the last four quarters
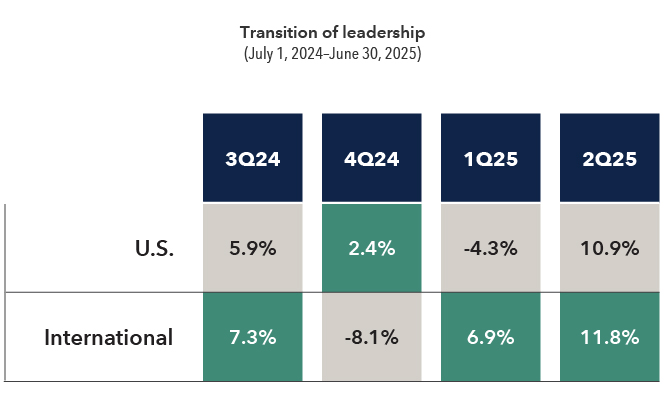
Source: Morningstar. U.S. is represented by S&P 500 Index and international by MSCI EAFE Index. As of June 30, 2025.
Fixed income looks well positioned.
Bonds seem to have settled in to steady returns after last year’s Federal Reserve interest rate cuts. Taxable bonds, represented by the Bloomberg U.S. Aggregate Index, notched a total return of 1.2% for the second quarter and 4% for the first half. Looking forward, markets are pricing in two additional rate cuts for 2025, which would provide a boost for bondholders.
Municipal bonds, as measured by the Bloomberg Municipal Short-Intermediate 1–10 Years Index, have posted strong results, returning 1.1% in the second quarter, although they trailed taxables for the first six months at 2%. The challenges that munis faced earlier in the year — an unusually high issuance that pressured prices and concerns that natural disasters such as the L.A. wildfires in January could crimp repayments — largely didn’t result in any impairments, as fundamentals remained solid. Rather, those lower prices and resultingly higher yields may have helped pave the way for robust second quarter returns.
In many ways, it seems clear that this is a period of geopolitical and economic transition, with the ultimate outcome unlikely in the immediate future. Though that can feel unsettling, it also presents opportunities for patient investors with a long-term perspective. The advisable course of action is to avoid reacting to fleeting twitches in daily headlines and to adhere to your investment strategy. A well-diversified portfolio doesn’t rely on a single source of gains and is less exposed to losses from any one industry, region or asset class.
Explore topics
The indexes are unmanaged and, therefore, have no expenses. Investors cannot invest directly in an index. Past performance is no guarantee of future results.
Bloomberg Municipal Short-Intermediate 1-10 Years Index is a market-value-weighted index that includes investment-grade tax-exempt bonds with maturities of one to 10 years. This index is unmanaged, and its results include reinvested distributions but do not reflect the effect of sales charges, commissions, account fees, expenses or U.S. federal income taxes.
Bloomberg US Aggregate Bond Index represents the U.S. investment-grade fixed-rate bond market. This index is unmanaged, and its results include reinvested dividends and/or distributions but do not reflect the effect of sales charges, commissions, account fees, expenses or U.S. federal income taxes.
MSCI EAFE® (Europe, Australasia, Far East) Index is a free float-adjusted market capitalization weighted index that is designed to measure developed equity market results, excluding the United States and Canada. Results reflect dividends net of withholding taxes. This index is unmanaged, and its results include reinvested dividends and/or distributions but do not reflect the effect of sales charges, commissions, account fees, expenses or U.S. federal income taxes.
S&P 500 Index is a market capitalization-weighted index based on the results of approximately 500 widely held common stocks. This index is unmanaged, and its results include reinvested dividends and/or distributions but do not reflect the effect of sales charges, commissions, account fees, expenses or U.S. federal income taxes.
Related insights
-
-
Market Volatility
-