Municipal Bonds
Categories
Bonds
High-yield bonds may be less sensitive to volatility today
 Tom Chow
 David Bradin
May 5, 2026
KEY TAKEAWAYS
- The credit market has evolved, with aggregate quality rising in the high-yield sector.
- Other aspects of risk profiles within high-yield fixed income have also shifted, such as use of proceeds, a greater portion of secured bonds and shorter duration.
- Tight spreads should not deter investors from selectively adding to or maintaining an allocation to high-yield bonds.
The historically tight high-yield bond spreads seen in the past few years may seem like a red flag to investors worried about volatility. After all, if difference between the risk-free rate and yield earned due to credit and other risks shrinks, that means less risk premium paid. But what if tighter spreads signal a green flag? The high-yield bond universe has evolved materially since before the 2008 global financial crisis (GFC) and in the years surrounding the pandemic.
Today’s spread levels reflect a changed high-yield market. Several trends have fundamentally altered the market’s risk profile, including improvements in average credit quality, an issuance cycle dominated by refinancing and the migration of incremental risk to loans and private credit. Moreover, the rise of secured high yield, the sector’s shorter duration and more flexible call structures further challenge traditional assumptions. Together these comparisons provide a clearer framework for evaluating high yield today.
Changing risk profile amid growth in private credit
The credit quality of the high-yield sector has increased significantly over the past 10 years. At the end of March 2026, 56% of the Bloomberg U.S. High Yield 2% Issuer Capped Index (“the high-yield index”) was rated BB/Ba, while 11% was rated CCC or below. This is a significant change from before the GFC, when BB-rated and CCC-rated issuers represented 46% and 15% of the index, respectively.
High-yield spreads have moved tighter as credit quality trended higher
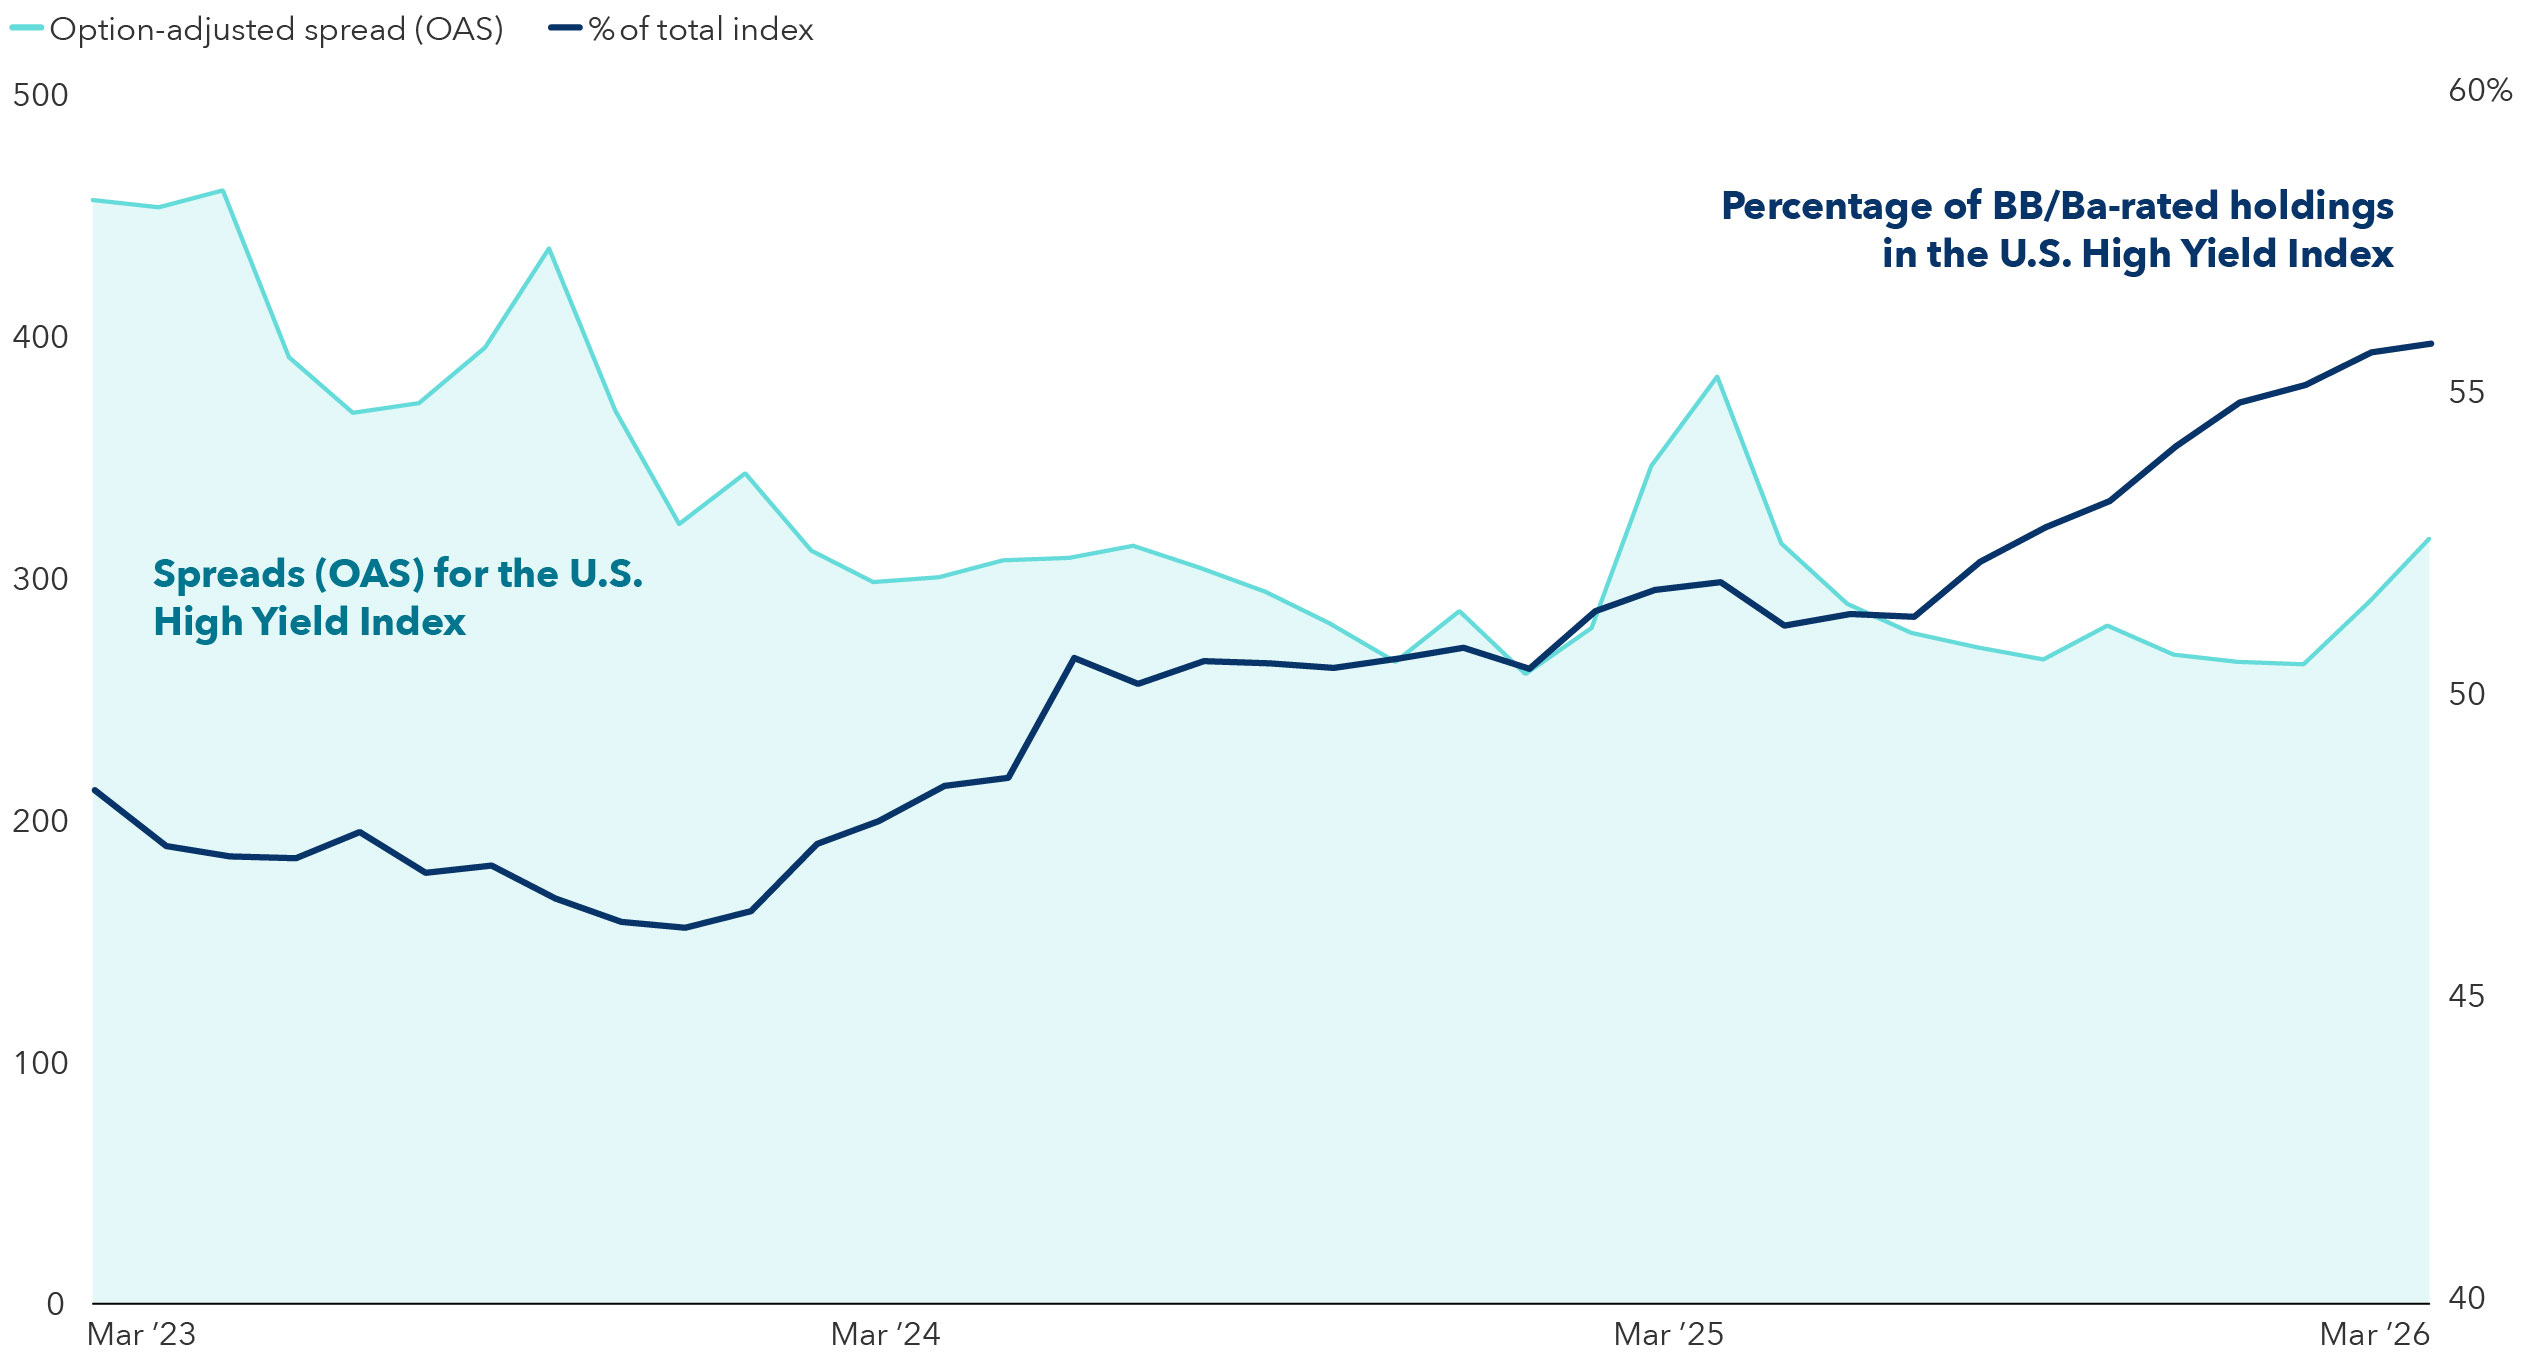
Sources: Bloomberg Index Services Limited. As of March 31, 2026. U.S. High Yield Index (the “high-yield index”) represented by the Bloomberg U.S. Corporate High Yield 2% Issuer Capped Index.
This improvement has been partly driven by the rise of leveraged loan and private credit markets, which have supplanted a significant amount of lower quality high-yield bond issuance. Over the past decade, private credit has absorbed much of the sponsor-backed leveraged buyouts and mergers and acquisitions activities. Previously, sponsors financed their deals in the high-yield bond market or through a combination of high-yield bonds and leveraged loans.
Issuance data illustrates this shift in financing demand. Over the last decade annual high-yield bond issuance has averaged less than $300 billion, compared to loan issuance that averaged $675 billion. In 2024 and 2025, loan issuance rose sharply, reaching $1.3 trillion and $984 billion, respectively, alongside the growth of the private credit market to $1.8 trillion.
The purpose of issuance has also changed. In high yield, 64% of bond issuance over the last 10 years was to refinance existing debt rather than to fund new borrowing. These refinancings were specifically to take care of pending maturities or to take advantage of existing call options, potentially at a lower interest rate. In the loan market, refinancing made up about 33% of issuance, with a similar share tied to acquisitions, a figure that surged to 56% at its peak in 2022. The high-yield bond market has benefited as private credit took on more levered acquisition financing deals.
High-yield issuance is increasingly being used for refinancings
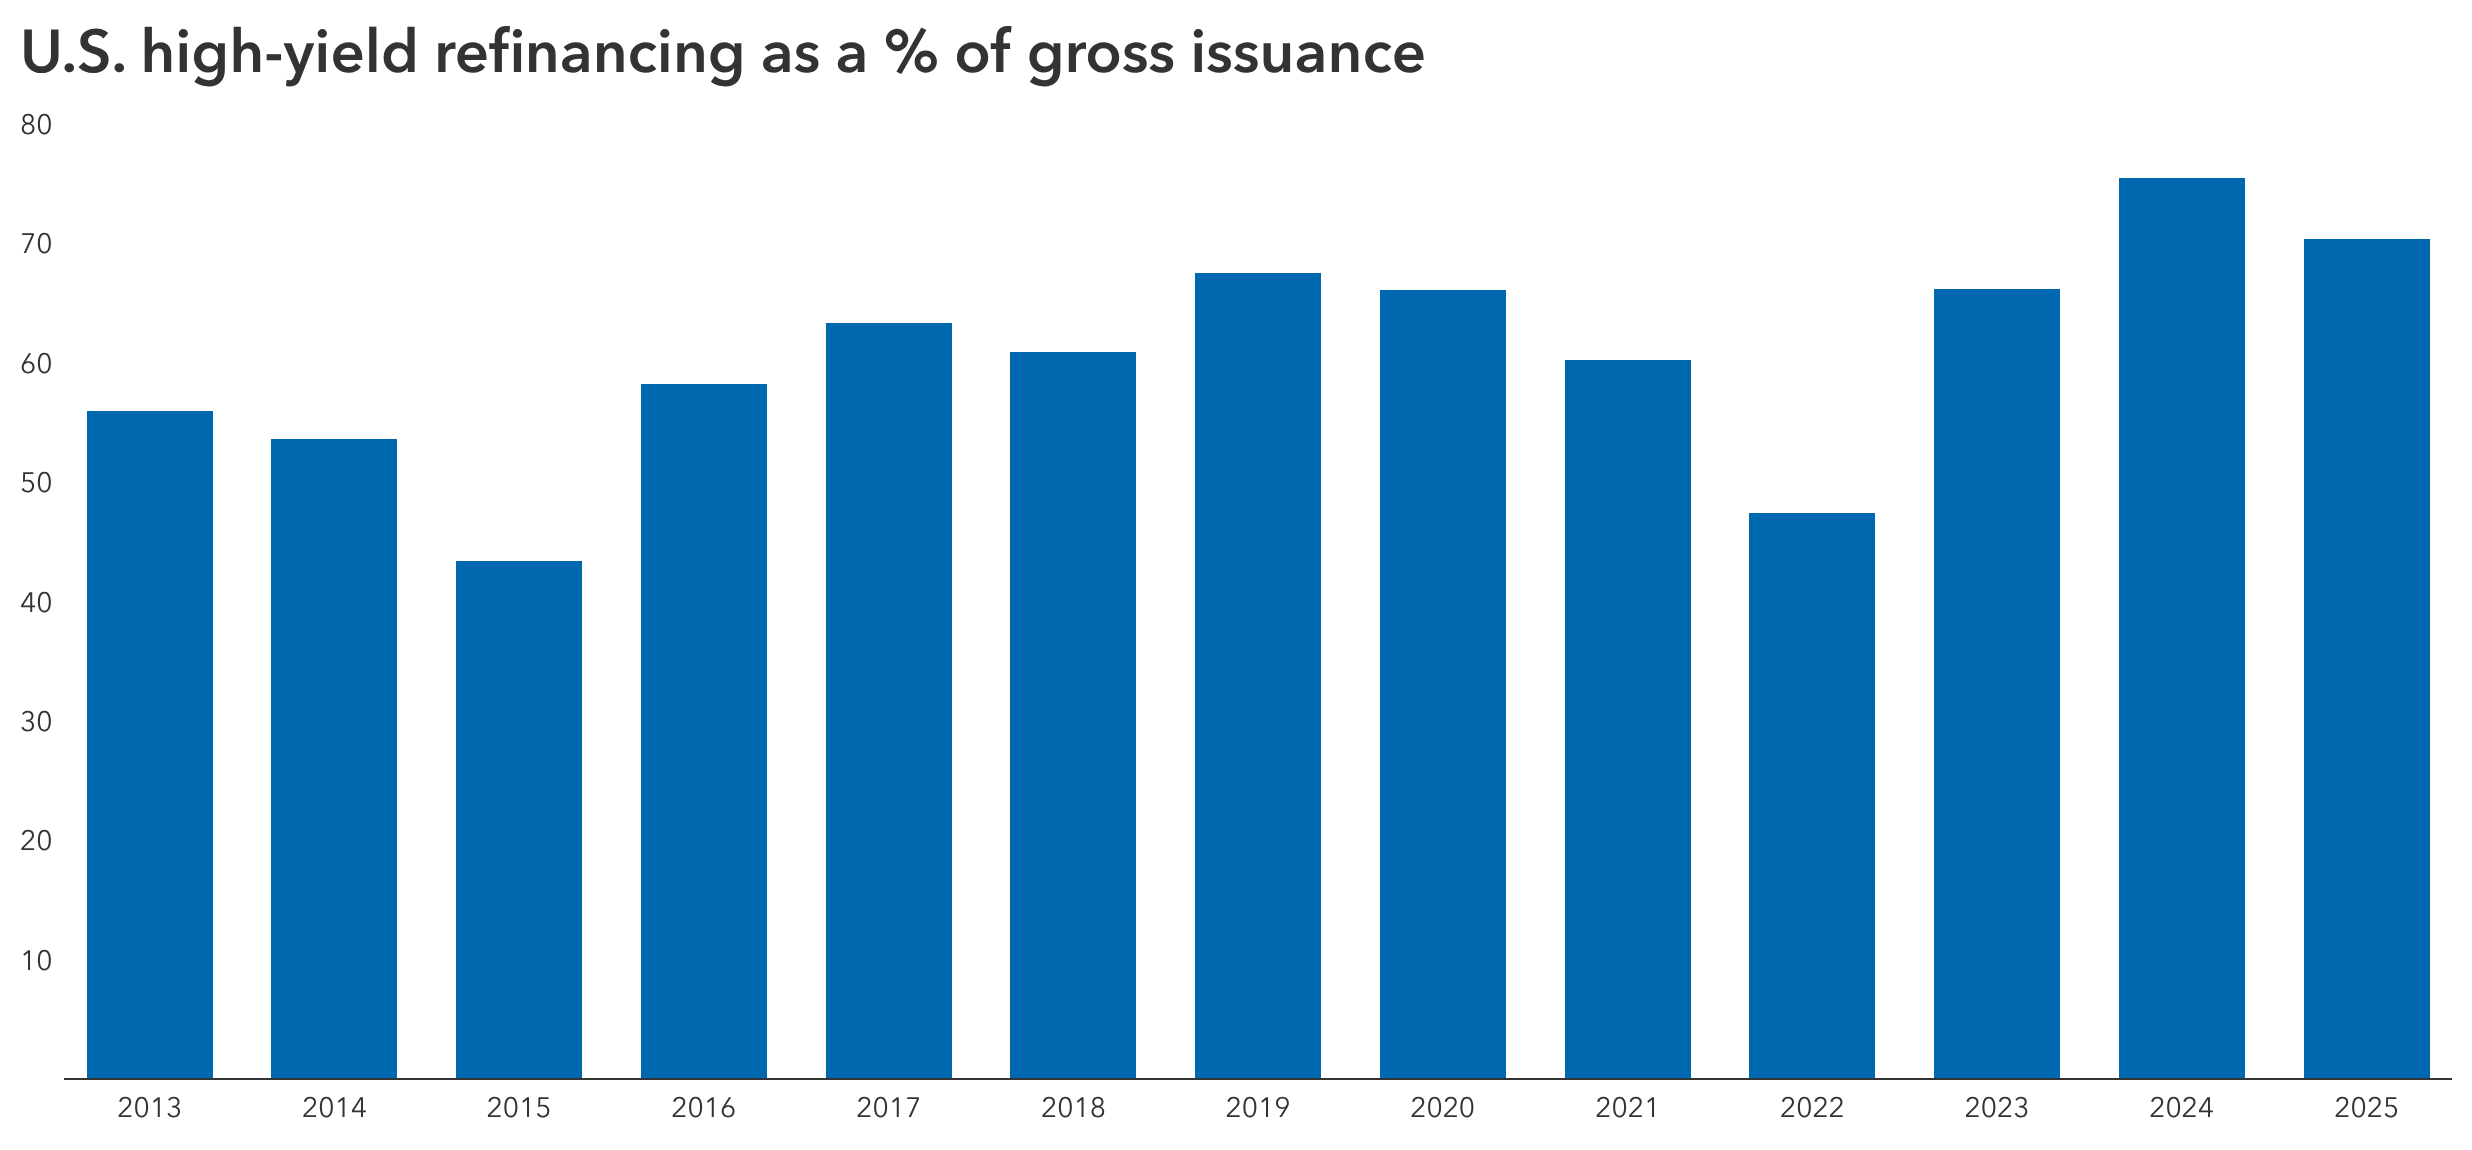
Source: J.P. Morgan. As of February 2026.
A growing share of secured bonds
The risk profile for high-yield bonds has improved as more companies issued secured bonds over the past decade. In 2025, 39% of high-yield issuance was secured debt, with 52% of first-time high-yield issuers in the market with senior secured paper, according to an annual report from J.P. Morgan. The rise of secure financing is near peak levels, having increased significantly in the last five years. Specifically, in 2025, 34% of the high-yield universe is now secured against a pool of collateral, up from 12% in 2007 prior to the GFC and 18% in 2020, ahead of the pandemic.
Duration has shortened
Another trend in the high-yield market has been a steady decline in duration over the past two decades. Generally, companies are seeking financial flexibility within their capital structure by staggering maturities and call options. Many issuers opted to issue shorter dated paper as interest rates rose in 2022 to avoid locking in higher rates. They also sought call structures that allow refinancing over a shorter time horizon than prior deals. Still, despite a structurally shorter duration profile over the past 15 years, longer dated issuance in the six-year-and-beyond timeframe may slowly return to pre-COVID levels.
Looking beyond spreads
Spreads are an indicator of risk and the compensation investors seek for taking that risk. As that risk has changed over time and demand for high yield has remained elevated, spreads are trading at the tight end of the range we would expect for this part of the economic cycle. Meanwhile, yield-based valuation is near the high-yield market’s 15-year average of 6.6%. Given today’s strong starting yield, income will likely be the largest driver of total return, which we expect to be in line with the sector’s historical average.
These aren’t the junk bonds of the past
Today’s high-yield market is structurally different than prior economic cycles. Quality has improved, risk has increasingly migrated to loans and private credit, and issuance has been dominated by refinancings alongside a meaningful rise in secured paper. These shifts help explain why spreads can look tight on the surface and why spread volatility has been more muted, even amid macro uncertainty.
In fact, looking at the recent bout of equity volatility in March 2026, option-adjusted spreads for the high-yield index only widened 26 basis points, while equities, as characterized by the S&P 500 Index, were down 5.0%. As we look ahead, the key is to evaluate spreads in the context of this evolved risk and maturity profile — focusing on issuer fundamentals, collateral position and refinancing pathways — rather than relying on historical comparisons alone.
High-yield bonds are a unique asset class that investors should not ignore given its potential yield advantage relative to other fixed income categories. The asset class is widely owned by dedicated high-yield bond funds and ETFs, but demand is high across some investment-grade corporate bond (BBB/Baa and above), core plus bond and multi-sector bond funds. Some of the largest institutional investors also have dedicated allocations to high yield.
Nevertheless, we remain mindful of its asymmetrical return profile. At the moment, all investors are attempting to decipher the same headlines: AI evolution, the Fed’s next move and global geopolitical developments. The irony is that despite the uncertainty, the U.S. economy appears quite solid. While valuations are near historical tight spreads, yields are still reasonable and those valuations could even improve further if interest rates start to drop and fundamentals strengthen. In a world where a single tweet can move markets materially, our job is to determine if a price move is temporary or longer term and to reposition efficiently, so timing is critical as well.
Learn more about
Past results are not predictive of results in future periods.
Option-adjusted spread measures the spread of a fixed income security rate and the risk-free rate of return, which is adjusted to take into account an embedded option.
Duration measures a bond’s sensitivity to changes in interest rates. Generally speaking, a bond's price will go up 1% for every year of duration if interest rates fall by 1% or down 1% for every year of duration if interest rates rise by 1%.
Bloomberg U.S. Corporate High Yield 2% Issuer Capped Index covers the universe of fixed-rate, non-investment-grade debt. The index limits the maximum exposure of any one issuer to 2%. This index is unmanaged, and its results include reinvested distributions but do not reflect the effect of sales charges, commissions, account fees, expenses or U.S. federal income taxes.
S&P 500 Index is a market capitalization-weighted index based on the results of approximately 500 widely held common stocks.
Don't miss our latest insights.
Our latest insights
RELATED INSIGHTS
-
Interest Rates
-
Economic Indicators
-
Asset Allocation
Don’t miss out
Get the Capital Ideas newsletter in your inbox every other week
Investments are not FDIC-insured, nor are they deposits of or guaranteed by a bank or any other entity, so they may lose value.
Bond ratings, which typically range from AAA/Aaa (highest) to D (lowest), are assigned by credit rating agencies such as Standard & Poor's, Moody's and/or Fitch, as an indication of an issuer's creditworthiness.
The return of principal for bond portfolios and portfolios with significant underlying bond holdings is not guaranteed. Investments are subject to the same interest rate, inflation and credit risks associated with the underlying bond holdings.
Lower rated bonds are subject to greater fluctuations in value and risk of loss of income and principal than higher rated bonds.
The indexes are unmanaged and, therefore, have no expenses. Investors cannot invest directly in an index.
Source: Bloomberg Index Services Limited. BLOOMBERG® is a trademark and service mark of Bloomberg Finance L.P. and its affiliates (collectively "Bloomberg"). Bloomberg or Bloomberg's licensors own all proprietary rights in the Bloomberg Indices. Neither Bloomberg nor Bloomberg's licensors approves or endorses this material, or guarantees the accuracy or completeness of any information herein, or makes any warranty, express or implied, as to the results to be obtained therefrom and, to the maximum extent allowed by law, neither shall have any liability or responsibility for injury or damages arising in connection therewith.
Statements attributed to an individual represent the opinions of that individual as of the date published and do not necessarily reflect the opinions of Capital Group or its affiliates. This information is intended to highlight issues and should not be considered advice, an endorsement or a recommendation.
All Capital Group trademarks mentioned are owned by The Capital Group Companies, Inc., an affiliated company or fund. All other company and product names mentioned are the property of their respective companies.
Use of this website is intended for U.S. residents only.
Capital Client Group, Inc.
This content, developed by Capital Group, home of American Funds, should not be used as a primary basis for investment decisions and is not intended to serve as impartial investment or fiduciary advice.