Economic Indicators
Categories
Market Volatility
5 charts that put market volatility in perspective
Fallout from the intensifying war in the Middle East has once again put market volatility in the spotlight.
Oil prices have surged, sending the cost of gasoline higher and increasing the prospect of a global energy-induced economic slowdown. Since U.S. and Israeli strikes on Iran began in late February, the S&P 500 Index has fallen about 3.16% through March 18. Meanwhile, the yield on the 10-year U.S. Treasury, a cornerstone of the global financial system, rose to 4.26% from 3.94% before the war, though it remains below where it began the year.
Should the worst oil supply shock in decades persist, investors may have doubts about their investment approach in such an uncertain environment. It’s natural to seek safer shores when markets are choppy. But it’s equally important to step back, gain perspective, and look beyond the horizon.
History shows the market has always recovered from previous declines. Here are five insights that can help you regain confidence and stay invested for the long haul.
1. When in doubt, zoom out
Think back to early 2022. Russia’s invasion of Ukraine delivered a geopolitical shock that rattled markets and dominated headlines, much like today. Brent crude climbed nearly 30% to a high of $128 per barrel. At the same time, central banks led by the U.S. Federal Reserve moved aggressively to raise interest rates, compounding uncertainty for investors already on edge.
How did stocks react? Fears that war and the fastest Fed rate hikes in decades would tip the global economy into a recession sent the S&P 500 Index down 19% in 2022. But the index staged a powerful rebound in 2023, gaining nearly 24% as inflation cooled, energy markets stabilized, and earnings proved more resilient than many investors expected. The episode serves as a reminder that markets often absorb shocks faster than headlines suggest.
Whether the market choppiness of early 2026 might give way to smoother sailing is impossible to know. But the upcoming midterm elections could steer the Trump administration to focus on more bread-and-butter issues that inspire economic optimism.
Market selloffs tied to oil supply shocks have been short-lived
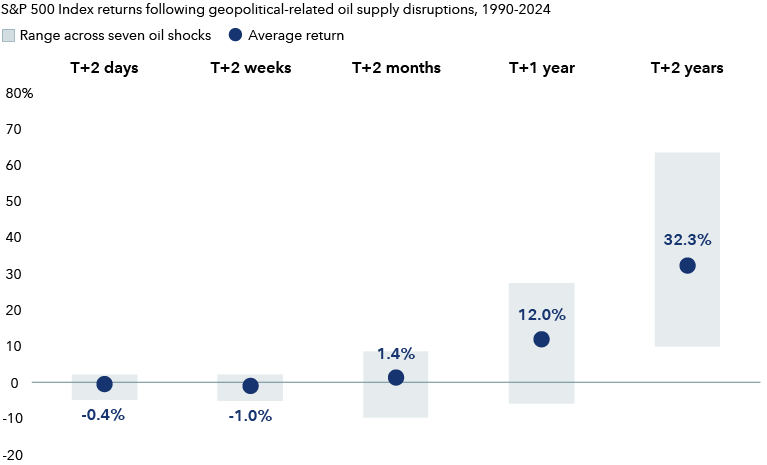
Sources: Capital Group, Bloomberg, Standard & Poor's. Specific geopolitical events that are reflected in average returns figures include: First Gulf War (August 1990), Second Gulf War (March 2003), Niger Delta supply disruptions (February 2006), Arab Spring and Libyan civil war (February 2011), Hormuz closure risk and Iran sanctions (December 2011), drone attack on Saudi oil stations (September 2019), Russian invasion of Ukraine (February 2022). Event dates are aligned to the nearest observable market price ("T"). If a shock occurs on a nontrading day, the prior trading day is used as the start date. Horizon returns are measured using the first available trading day on or after the stated calendar horizon (e.g., "T+2 days"). Figures reflect total returns. As of March 10, 2026.
2. Markets typically have recovered quickly
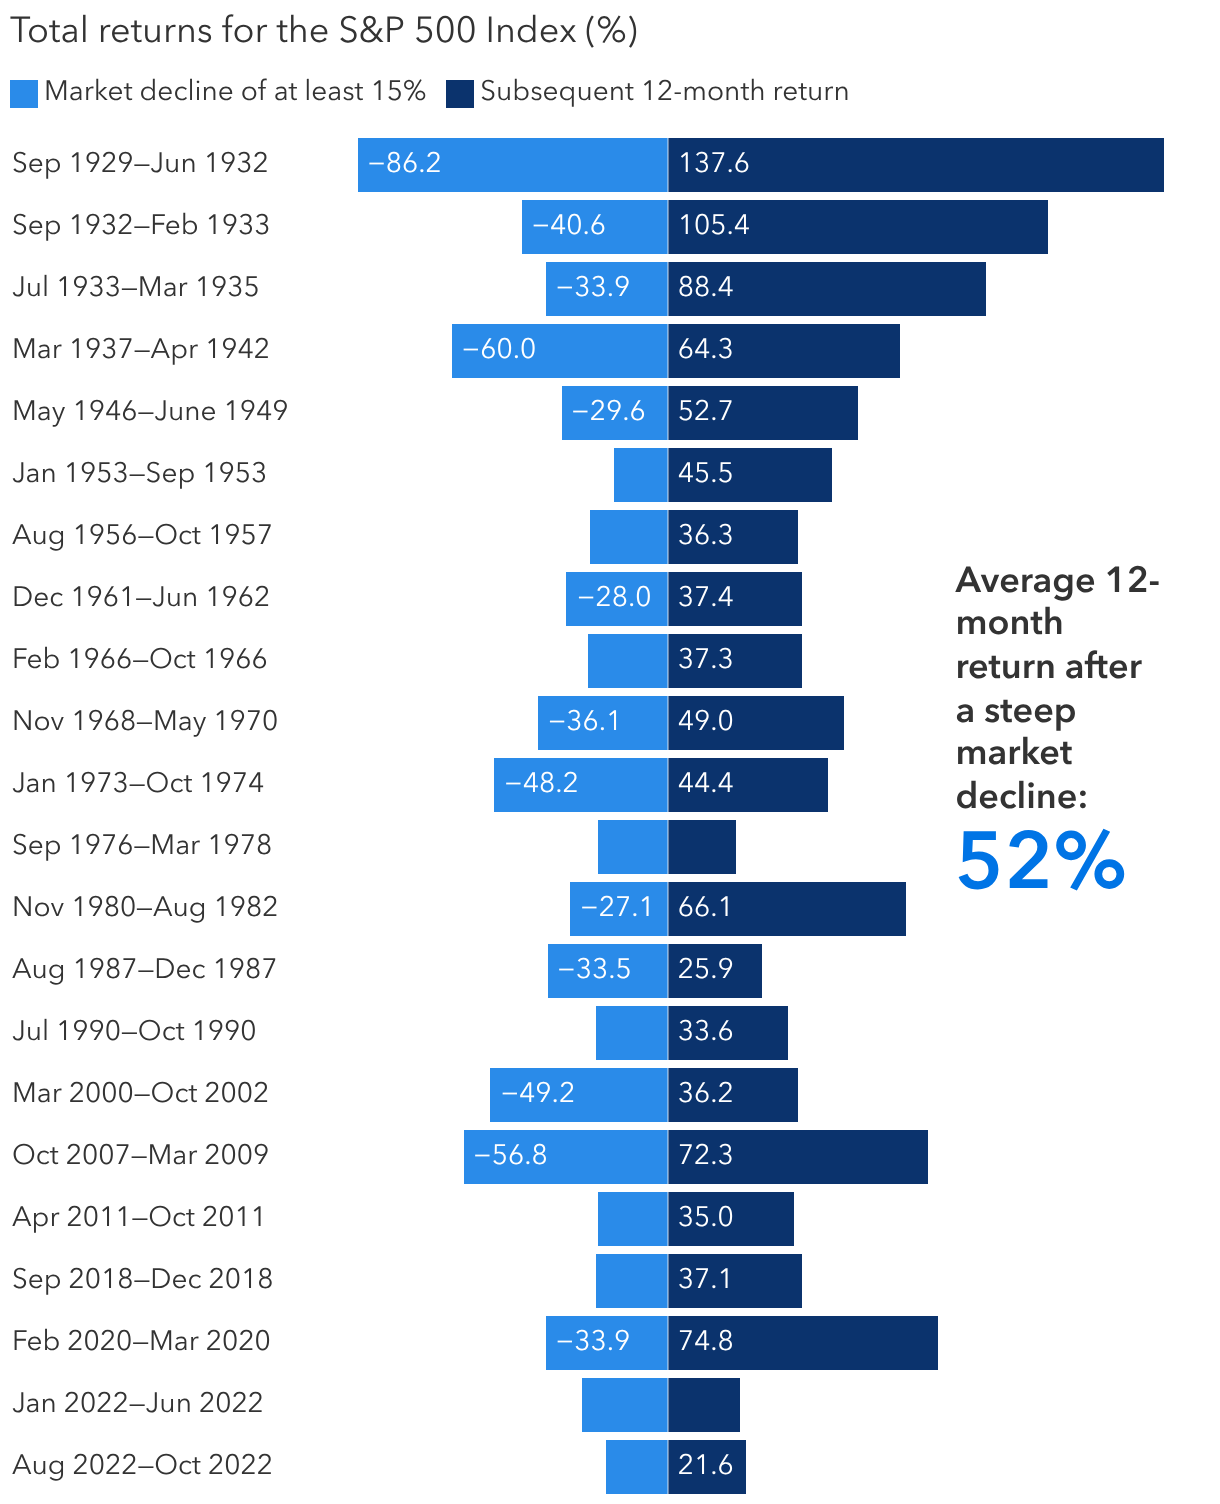
Although markets declined during volatile periods, they often bounced back quickly. Indeed, stock market returns are typically stronger after sharp declines. The average 12-month return immediately following a 15% or greater decline is 52%. That’s why it’s usually best to remain calm and stay invested.
Stock market returns have been strong after steep declines
Sources: Capital Group, RIMES, Standard & Poor's. Each market decline reflects a decline of at least 15% in the value of the S&P 500 Index, without dividends reinvested. Latest bear market from February 19, 2025, through April 8, 2025, is excluded due to being less than one year ago as of the publish date. As of February 28, 2026.
How often have market corrections of 10% or more turned into entrenched bear markets? Turns out, not often. Instead, short periods of pullbacks ranging from 5% to 10% have been more common. While these may feel unsettling, a drop of 5% occurred on average twice per year while corrections of 10% or more happened every 18 months on average. And while intra-year declines are common, the good news is 38 of the last 50 calendar years have finished with positive returns.
What’s more, a selloff can create investment opportunities. For example, during the pandemic investors punished a broad swath of travel and leisure companies — including Royal Caribbean, which fell 83% from January 20, 2020, to March 18, 2020 — as lockdowns brought air travel, cruises and hotel bookings to a halt.
Certain travel and leisure stocks have since staged a dramatic recovery. Royal Caribbean returned 334% from the low reached on March 18, 2020, to its peak price on June 2, 2021, as national vaccination rates and confidence grew. Identifying investment opportunities requires skill and experience, especially when markets are volatile. Bottom-up fundamental analysis may help investors balance short-term volatility with a longer term perspective.
3. Bear markets have been relatively short-lived
A long-term focus can help investors put bear markets in perspective. Since 1949, there have been 11 periods of 20%-or-greater declines in the S&P 500. Although the average 33% decline during these cycles is painful to endure, missing out on the average bull market’s 265% return could be far worse.
Bear markets are typically shorter than bull markets, lasting an average of 12 months. While that can feel like an eternity, it pales in comparison to the average bull market, which lasts for 67 months — another reason that trying to time investment decisions is ill-advised.
Bull markets are much longer and stronger than bears

Sources: Capital Group, RIMES, Standard & Poor's. As of February 28, 2026. The bull market that began in 2022 is considered current as of February 28, 2026, and not included in the average bull market calculations. Bear markets are peak-to-trough price declines of 20% or more in the S&P 500. Bull markets are all other periods. Returns shown on a logarithmic scale.
Forecasting the start of the next recession is difficult. Many investors, for example, braced for a recession when the Federal Reserve raised rates in 2022 to combat sky-high inflation. Instead, the U.S. economy grew, with markets posting double-digit gains in 2023, 2024 and 2025.
In the current environment, the closure of the Strait of Hormuz increases the risk of recession because of its significance as a vital passageway for one-fifth of the world’s oil. Higher energy costs could weigh on businesses and consumers, reducing earning potential for many companies. But the economy has surprised to the upside before, and it’s too early to tell if widespread job losses — the hallmark of a recession — will occur.
4. Bonds can offer balance when needed most
In periods of slowing economic growth, bonds often shine brightest. In fact, it’s the reason high-quality core bond funds are often the foundation of a classic 60% equities and 40% bonds portfolio. While the exact allocation may shift, a diversified portfolio is intended to generate attractive returns while reducing risk.
Bonds are known to zig when equity markets zag. That reaction could take time to play out as investors react to near-term dynamics before digesting the war’s risks to the overall economy. Currently, markets are focused on the potential inflationary shocks tied to a disruption in the world’s oil supply rather than the possibility of declining growth. The U.S. may prove to be less sensitive to inflationary pressures from an energy price shock than other countries, giving the Fed room to respond to growth challenges that may arise from higher energy prices.
For its part, the Fed is likely to balance rate cuts with inflationary pressures from geopolitical uncertainties, so cuts may be slower to materialize absent a more pronounced economic downturn. Rate-cutting cycles have typically supported solid returns for core bonds, as represented by the Bloomberg U.S. Aggregate Bond Index. Because yields are higher today following the Fed’s rate-hiking cycle in 2022, bonds have a higher income cushion to help absorb price volatility should rates rise.
Moreover, with bonds offering healthy income potential, investors may be able to take less risk with high-quality bonds while still meeting their return expectations.
Bonds have offered resilience during equity selloffs
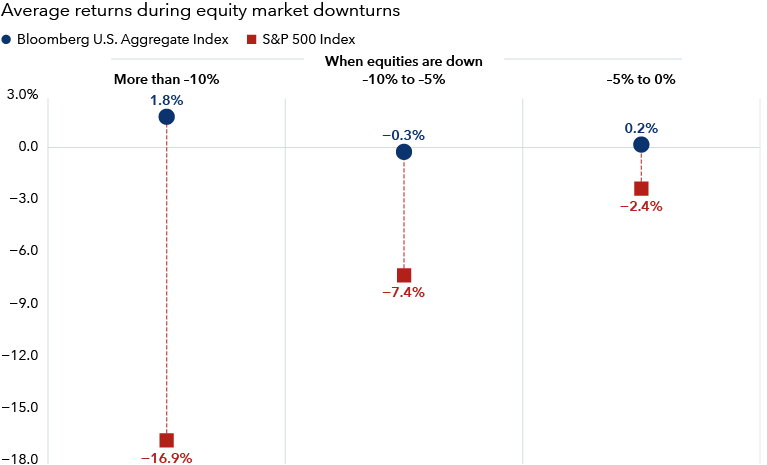
Sources: Capital Group, Bloomberg. Figures reflect monthly data using rolling three-month total returns between February 2006 and February 2026. Total number of decline periods is 63, or 26% of all monthly periods in the sample. As of February 28, 2026.
5. Staying the course has paid off for long-term investors
When markets are volatile, it’s hard to resist the urge to do something. Suggestions to stay the course offer little comfort when markets and emotions are spiraling. But in many cases, the best course of action has been none at all.
No two events are the same, and the war in Iran feels especially close to home given direct U.S. involvement. Beneath the unease are broader questions about the durability of rules-based systems and geopolitical alliances that have anchored decades of relative economic stability. As globalization continues to evolve, markets may be forced to contend more frequently with sudden disruptions.
Take the sweeping tariffs President Trump levied on nearly all major U.S. trading partners in the spring of 2025. The S&P 500 Index plunged as much as 18.7% from its peak in February as investors feared a global economic downturn. Those worries later eased amid trade deals and continued economic resilience. By year-end, the S&P 500 Index recovered and finished up 17.9%.
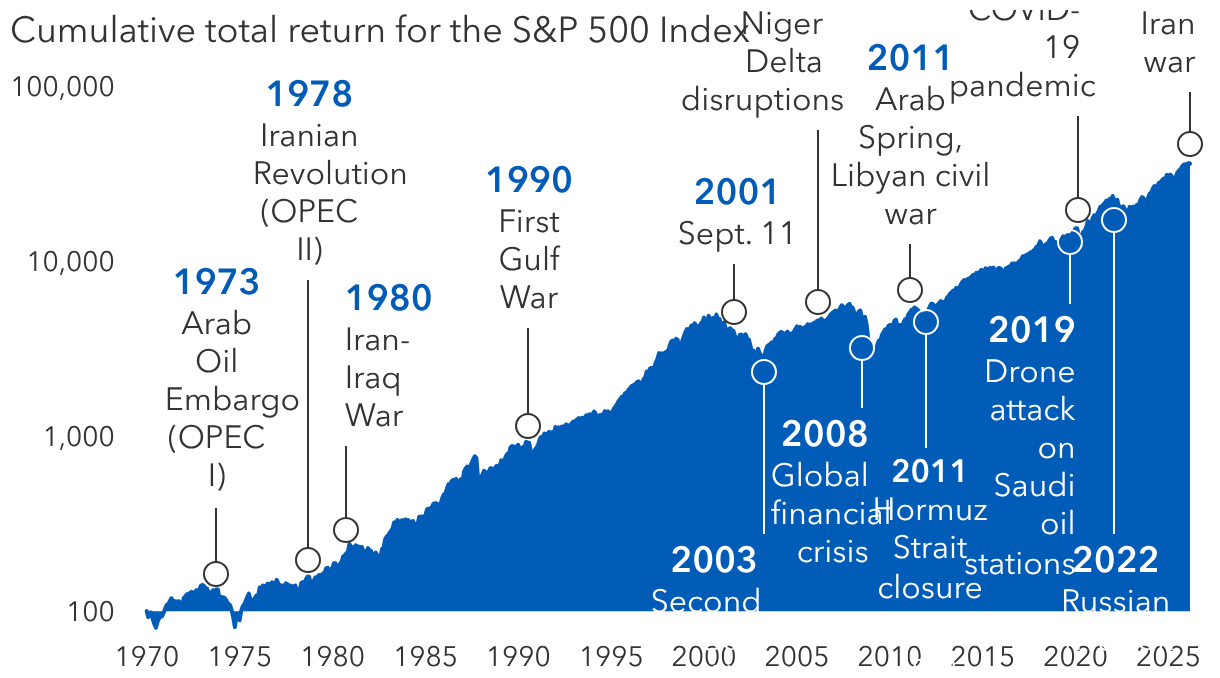
Markets have powered through previous oil crises
Sources: Capital Group, LSEG, Standard & Poor's. As of February 28, 2026. Data is indexed to 100 as of January 1, 1970, based on cumulative total returns for the S&P 500 Index. Shown on a logarithmic scale. Event dates are aligned to the nearest observable market price. If an event occurs on a non‑trading day, the prior trading day is used as the start date.
The lesson? Market declines can be painful, but rather than trying to time the market, investors would be wise to stay the course. To weather market volatility, they should seek diversification across stocks and bonds while periodically examining their risk tolerance for elevated volatility. Though it may feel like this time is different, markets have shown resilience throughout history when confronted by wars, pandemics and other crises.
Learn more about
Past results are not predictive of results in future periods.
The market indexes are unmanaged and, therefore, have no expenses. Investors cannot invest directly in an index.
S&P 500 Index is a market capitalization-weighted index based on the results of approximately 500 widely held common stocks.
Bloomberg U.S. Aggregate Index represents the U.S. investment-grade fixed-rate bond market.
BLOOMBERG® is a trademark and service mark of Bloomberg Finance L.P. and its affiliates (collectively “Bloomberg”). Bloomberg or Bloomberg’s licensors own all proprietary rights in the Bloomberg Indices. Neither Bloomberg nor Bloomberg’s licensors approves or endorses this material, or guarantees the accuracy or completeness of any information herein, or makes any warranty, express or implied, as to the results to be obtained therefrom and, to the maximum extent allowed by law, neither shall have any liability or responsibility for injury or damages arising in connection therewith.
The S&P 500 Index is a product of S&P Dow Jones Indices LLC and/or its affiliates and has been licensed for use by Capital Group. Copyright © 2026 S&P Dow Jones Indices LLC, a division of S&P Global, and/or its affiliates. All rights reserved. Redistribution or reproduction in whole or in part is prohibited without written permission of S&P Dow Jones Indices LLC.
Our latest insights
-
-
Market Volatility
-
Asset Allocation
-
World Markets Review
-
Regulation & Legislation
RELATED INSIGHTS
-
Market Volatility
-
Asset Allocation
-
Market Volatility
Don’t miss out
Get the Capital Ideas newsletter in your inbox every other week
Investments are not FDIC-insured, nor are they deposits of or guaranteed by a bank or any other entity, so they may lose value.
Investors should carefully consider investment objectives, risks, charges and expenses.
This and other important information is contained in the prospectuses and summary prospectuses, which can be obtained from a financial professional and should be read carefully before investing.
Statements attributed to an individual represent the opinions of that individual as of the date published and do not necessarily reflect the opinions of Capital Group or its affiliates. This information is intended to highlight issues and should not be considered advice, an endorsement or a recommendation.
All Capital Group trademarks mentioned are owned by The Capital Group Companies, Inc., an affiliated company or fund. All other company and product names mentioned are the property of their respective companies.
Use of this website is intended for U.S. residents only.
Capital Client Group, Inc.
This content, developed by Capital Group, home of American Funds, should not be used as a primary basis for investment decisions and is not intended to serve as impartial investment or fiduciary advice.