Categories
Interest Rates
What happens if U.S. debt becomes unsustainable?
Jason Davis
Investment Analyst
Doug Kletter
Investment Analyst
Arjun Madan
Investment Analyst

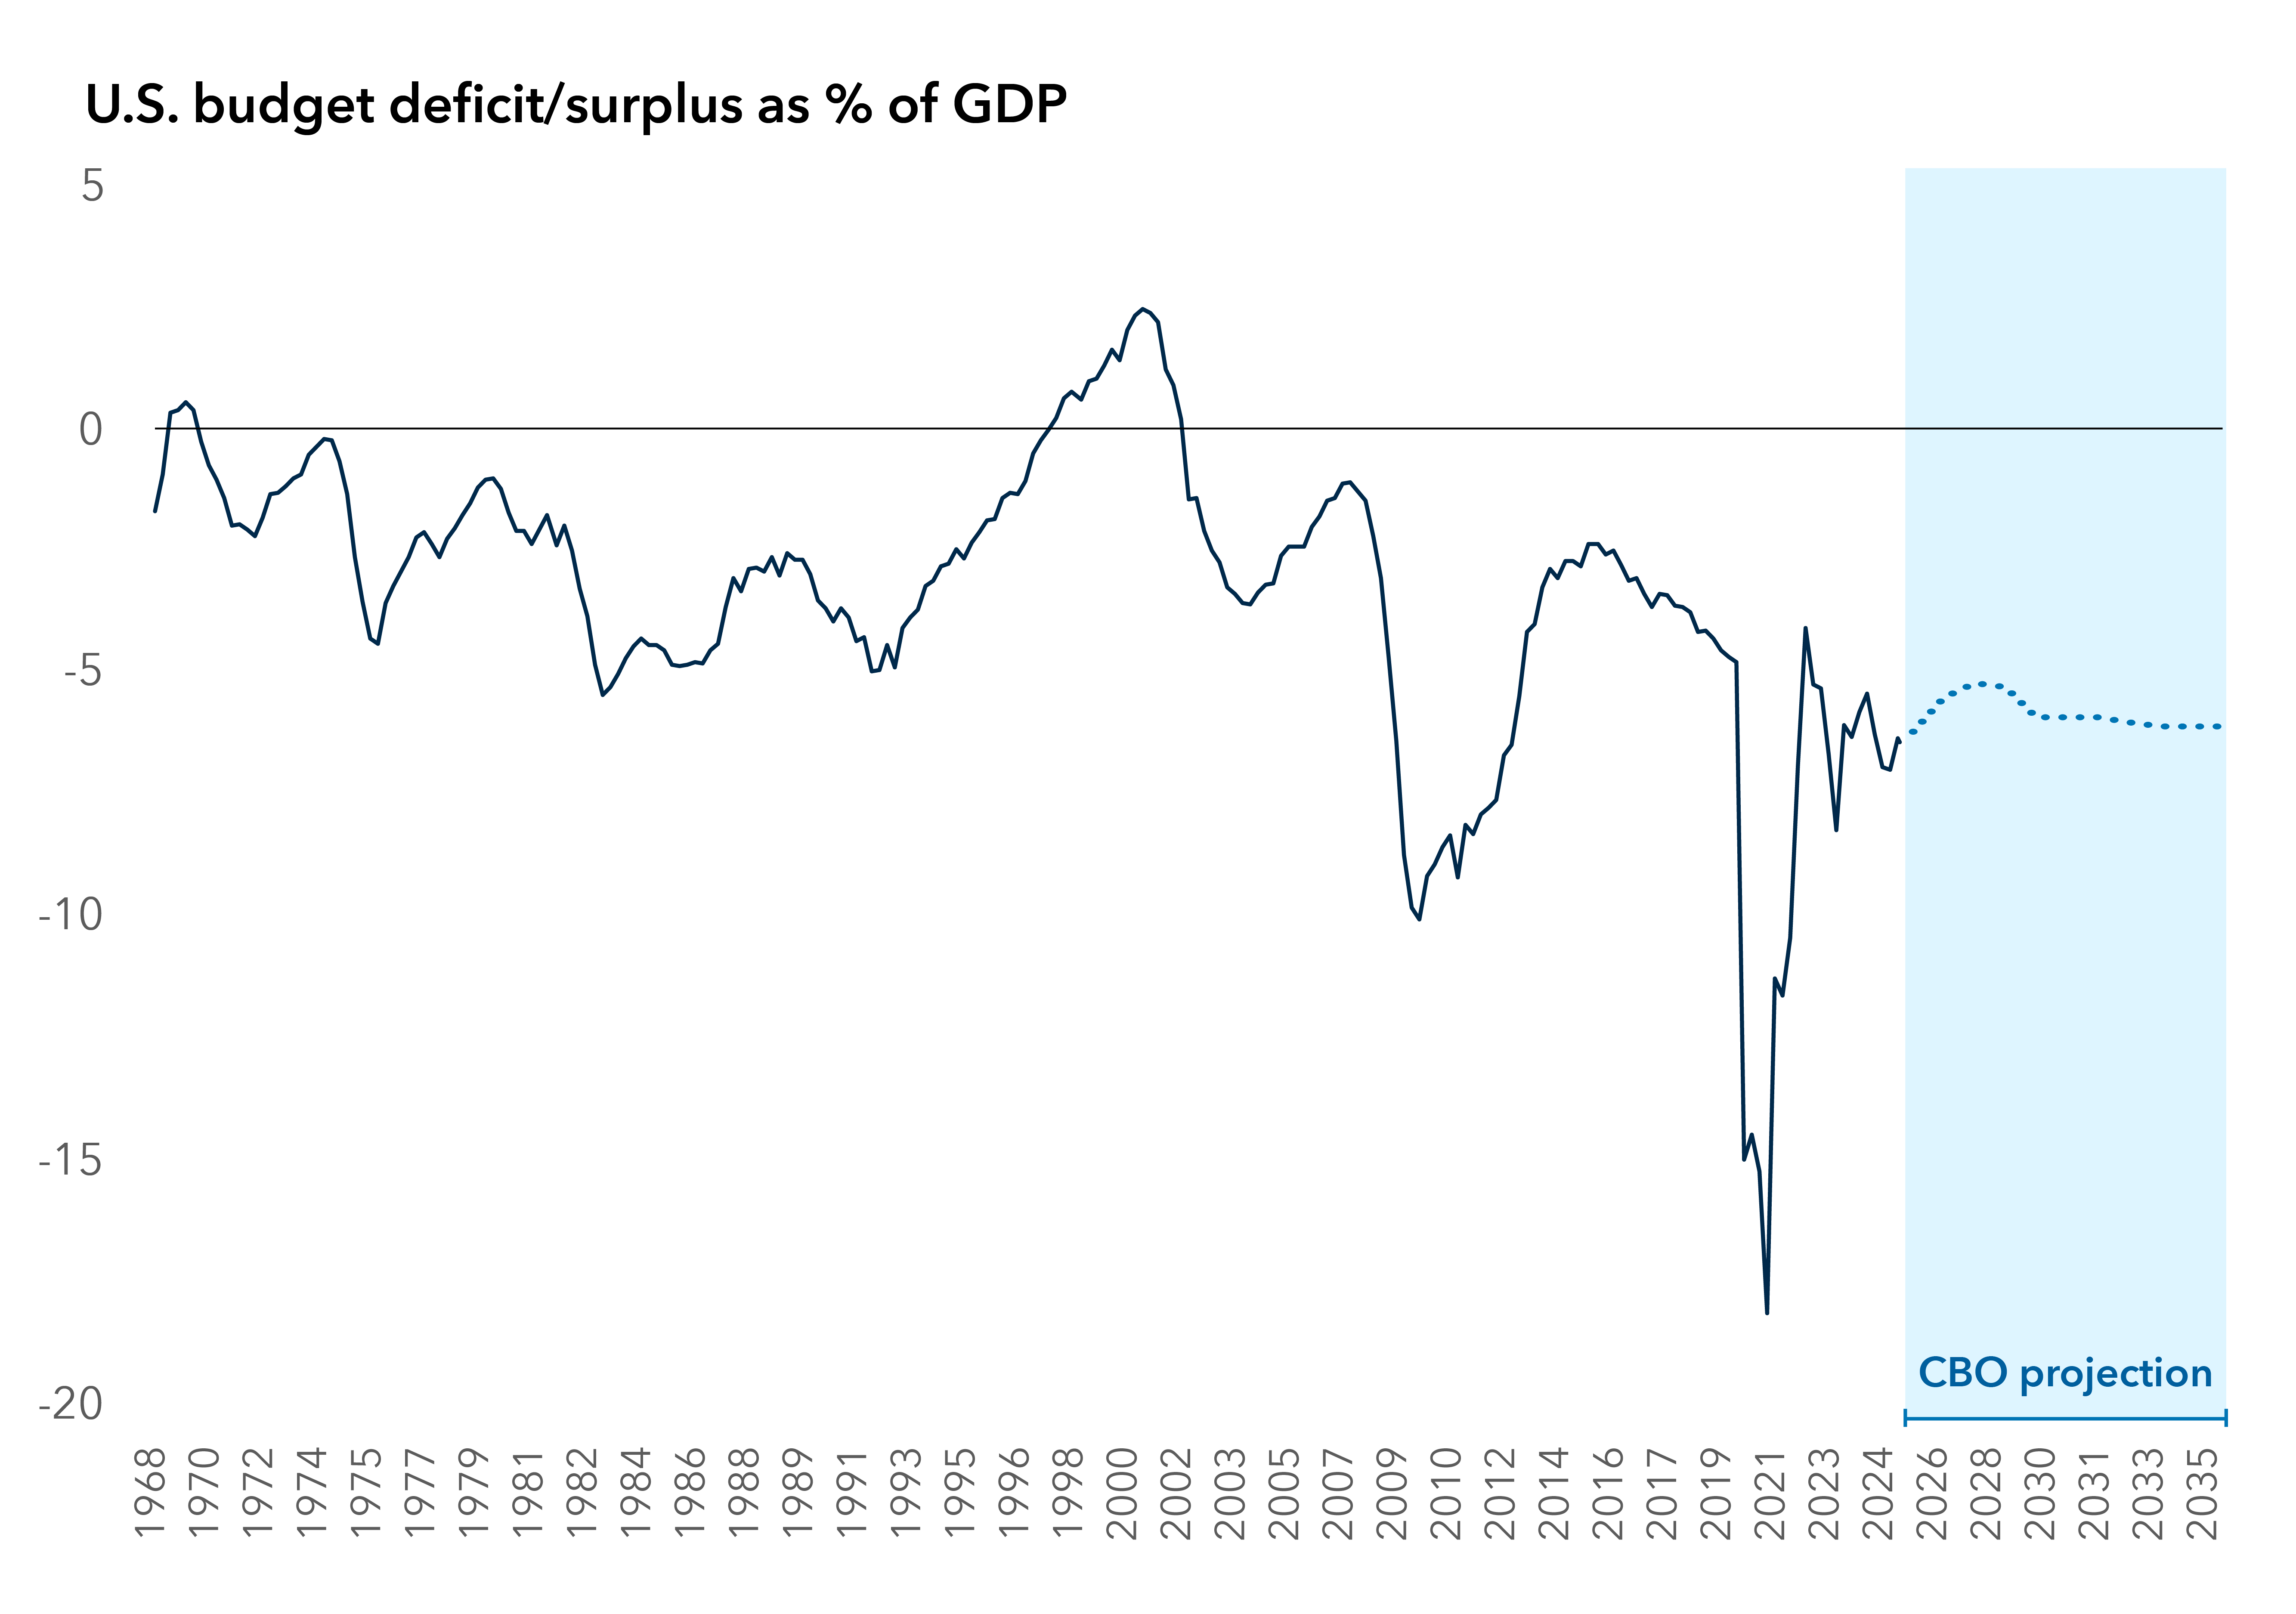
Is the U.S. national debt growing out of control? Predicting when or if a tipping point may be reached is difficult (or impossible), but the country faces growing fiscal challenges as its soaring interest burden is heightening concerns about long-term debt sustainability.


To be clear, there is no indication that a crisis is imminent. The federal government has operated with a deficit for much of its existence, and this has not resulted in significant challenges for either the bond market or the broader economy. That said, the increasingly perilous debt dynamics could eventually create problems without some sort of corrective measures. And it is prudent to examine the scenarios that could play out should we ever get to that point.


What is a sustainable level of yields for U.S. Treasuries? 


Over the past two decades, U.S. debt held by the public has risen from about 60% of gross domestic product (GDP) to nearly 100% today, mainly due to the fallout from heightened deficits following the global financial crisis (GFC) and COVID-19. Forecasts like those from the Congressional Budget Office (CBO) project similar deficit spending for at least the next decade.


Deficits are expected to continue at or near current levels

Line chart shows the U.S. budget deficit or surplus on a quarterly basis from 1968 to 2035. Data beyond 2025 is based on projections from the Congressional Budget Office. The chart shows the U.S. has operated with a budget deficit for most of this period, and only ran a surplus in the late 1960s and late 1990s/early 2000s. The deficit hit its lowest point, around -18%, in 2021 and currently sits around -6%. Forward looking projections show the deficit is likely to sit around these levels for the next decade.

Sources: U.S. Treasury. U.S. Congressional Budget Office (CBO). Data as of 7/31/25.

Until recently, the U.S. interest burden has remained subdued, despite the deficit, as the ballooning debt stock has been offset by low interest rates. However, the interest burden has begun increasing as interest rates have risen closer to long-term historical levels. Some projections suggest that, by 2050, interest payments on federal debt could double as a share of GDP and take up more than a third of government revenue. While there’s hope that economic growth will outpace real interest rates, this is highly uncertain. If growth fails to stay ahead of interest rates, the debt situation could deteriorate rapidly. When the interest burden exceeds nominal growth, this means that debt would be unsustainable even if governments run balanced budgets. 


Interest costs approach unsustainable levels

Line chart shows the U.S. interest cost as a percentage of GDP and nominal GDP growth from 1980 to 2025. For the majority of this period, interest costs have remained below GDP growth. Instances where interest costs have gone higher than GDP growth occurred in 1991, 2008-2009 and 2020. These periods lasted two, five and three quarters, respectively. Interest costs were mostly above 2% of GDP before 2001 but then fell below 2% until 2022, when they began rising. As of April 2025, net interest cost was above 3% of GDP. At the same time, GDP growth has fallen sharply from its post-COVID peak in 2021, leading the two lines to begin to converge.

Source: Bureau of Economic Analysis. Data as of 8/21/25.

Historically, Treasury yields have rarely gone above the interest burden as a percentage of GDP. If interest rates settle modestly below the economic growth rate, that could leave 10-year U.S. Treasuries below 4.5%, absent a large upshift in growth or inflation, although a more significant shock to rates may not be out of the question. 


That said, a crisis sparked by mass flight from Treasuries seems unlikely. The U.S. government’s ability to issue debt exclusively in its own currency and see predictable demand from investors who utilize Treasuries as the predominant safe asset of the world provides a unique level of flexibility. Outside of Treasuries, the investable universe of large, liquid, relatively safe and convertible debt is small.


The U.S. dollar dominates global fixed income markets

Column chart shows market value of five different sectors of the fixed income market (based on Bloomberg indexes) broken down by currency. Most of these sectors have a majority of assets denominated in U.S. dollars. Global high yield has 82% of assets in U.S. dollars, 17% in euros and 2% in British pounds. Emerging markets debt hard currency has 86% of assets in U.S. dollars and 14% in euros. Global securitized has 83% of assets in U.S. dollars, 11% in euros and 5% in other currencies. Global investment-grade corporate has 66% in U.S. dollars, 25% in euros, 4% in British pounds, 1% in Japanese yen and 4% in other currencies. Global treasury has 34% in U.S. dollars, 23% in euros, 5% in British pounds, 17% in Japanese yen and 21% in other currencies. Numbers may not add to 100 due to rounding.

Source: Bloomberg. 5/31/25. USD = U.S. dollar, GBP = British pound, JPY = Japanese yen. Global high yield (HY) = Bloomberg Global High Yield Corporate Index, emerging markets (EM) debt hard currency = Bloomberg EM Hard Currency Aggregate Index, Global Securitized = Bloomberg Global Aggregate Securitized index, Global Investment Grade (IG) Corporate = Bloomberg Global Aggregate Corporate Index, Global Treasury = Bloomberg Global Treasury Index. Others = all other currencies of issuance excluding USD, EUR, GBP and JPY.

If the U.S. debt becomes unsustainable, how can it get back on track? 


To reverse a rise in the debt-to-GDP ratio, one of four things would need to occur:  
 

  • Higher inflation
  • Financial repression
  • Austerity
  • Higher growth

1.  Higher inflation


If the Fed allows inflation to run above its 2% target, it could help reduce the debt burden, but this path seems unlikely to solve the problem over the long term. Higher inflation is difficult to maintain politically. Once inflation expectations adjust upward, there would only be a short window to inflate away the debt before interest rates would need to rise to ensure price stability.


In this scenario, the U.S. dollar would be expected to weaken, which would further increase inflation (mainly through higher import prices) and potentially boost exports and economic growth. However, there is a potential limit to how much this may help drive down the debt, as the falling value of the dollar may eventually dent investor confidence in the U.S. and could, at some point, threaten its reserve currency status.


While the context and situations differ sharply from the U.S., Italy allowed for high inflation as a tool to manage its debt after World War II until it joined the euro. The result was currency depreciation, investor flight and stagflation, which led to poor living standards and rising unemployment. 


2. Financial repression 


Financial repression with some combination of implicit yield pegs and debt monetization could be the most likely scenario. The goal would be to keep nominal 10-year yields below nominal growth for an extended period. But this likely only works if inflation expectations remain low, such as in Japan during its quantitative easing era. If financial repression and large deficits lead to higher inflation, the situation could become untenable. 


The Federal Reserve’s ability to maintain stable inflation expectations is crucial. This could be more challenging for the U.S. than it was for Japan. Numerous factors in Japan, such as a higher household savings rate, low wages and a declining population, helped keep consumer demand and inflation low. 


Financial repression implies very negative real yields (due to some form of yield curve control), requiring central banks to swallow up most of the markets, like the Bank of Japan. Such an outcome could lead investors to worry that the Fed has lost its independence, unless the central bank could convince markets that this action was required to maintain financial stability. 


The Treasury can also help with financial repression at the margin by adjusting the maturities of the bonds it issues. The market reaction and this scenario’s ultimate success are likely to depend on whether the market believes any commensurate rise in inflation is transitory.


3. Austerity 


An implicit acceptance of higher inflation, central bank accommodation and ongoing large deficits may work for a while, but ultimately, fiscal restraint could be the necessary end game. But austerity typically only comes after a shock.


Governments do not tend to run tighter budgets unless the market forces them, and these policies usually only come after the central bank and/or the Treasury tries to step in. As stated above, a crisis in the U.S. does not seem likely, but the markets are already periodically testing governments. We’ve seen extremely large standard deviation moves in bond yields in the U.K. and France that forced governments to address debt sustainability. And yields can greatly overshoot a sustainable level before action is taken.


If we come to this point, austerity would be particularly complicated for the U.S. to implement. Government spending is dominated by Medicare, Social Security and defense, and there appears to be little bipartisan appetite for spending cuts in these areas.


Medicare, Social Security and defense make up bulk of U.S. spending

Column chart shows a breakdown of U.S. government outlays for fiscal year 2025. Medicare accounts for $1.3 trillion of total outlays. Social security represents $1.25 trillion, national defense represents $1.06 trillion, net interest represents $0.94 trillion and everything else is $2.95 trillion.

Source: Bureau of the Fiscal Service. Data as of 8/21/25. “Everything else” includes: health, income security, general government, veterans’ benefits and services, transportation, education, training, employment and social services, natural resources and environment, commerce and housing credit, community and regional development, administration of justice, energy, agriculture, international affairs, general science, space and technology and other unreported data.

4. Higher growth 


The least painful way to escape the problem would be through accelerated growth and lower inflation. This may seem unlikely, as real rates have been on a structural uptrend and it could take some time for growth to accelerate enough to keep pace. But over the longer term, there could be cause for hope. 


Significant non-inflationary productivity benefits from AI and robotics could take shape with the U.S. potentially leading. If generative AI succeeds, even moderately, nominal GDP growth could rise above CBO projections. Over a decade, this compound growth difference could materially reduce debt-to-GDP ratios. 


Federal debt could drop in an optimistic scenario

Line chart shows three potential paths for U.S. federal debt held by the public as a percentage of GDP. All three lines begin at 98%. The CBO baseline shows this metric growing to 118% by 2035. The Fed implied path, which is calculated based on inflation and growth projections from the summary of economic projections, shows debt growing to 115% of GDP by 2035. And the “slightly more optimistic macro scenario,” which is calculated with 0.5% higher inflation, 0.5% higher productivity and 100 basis points lower 10-year Treasury yields than the CBO baseline shows the debt growing to 105% of GDP by 2035.

Sources: Capital Group, Capital Strategy Research, Congressional Budget Office, Federal Reserve. Data as of June 2025. More optimistic scenario = 0.5% higher inflation, 0.5% higher productivity, 100 basis points (bps) lower 10-year Treasury yield than CBO baseline.

If the U.S. maintains or widens its tech leadership, its debt outlook should improve relative to others. If the productivity gap between the U.S. and other countries holds or expands, relative debt burdens would be less concerning. Technological change may also be disinflationary. Historically, major technologies (e.g., electricity, semiconductors) have reduced costs and prices. AI may exert similar downward pressure on inflation. 


That said, if generative AI disappoints or has setbacks, it may also be beneficial for bonds, assuming the U.S. continues to be the global reserve currency and safe-haven asset. If yields fall, it could allow the U.S. to lower its debt burden and potentially extend out maturities again.


Where do we go from here? 


A large increase in the risk premium on U.S. Treasuries seems unlikely, but debt sustainability continues to matter. If the issue comes to a head, inflation and financial repression would likely follow, and austerity could ultimately be the only way out. This all speaks to a higher term premium on Treasuries and/or a weaker U.S. dollar until austerity becomes a real possibility.


That said, there is still reason for optimism. Long-term debt sustainability is fundamentally a function of future GDP growth, not just current deficits. Technological change — particularly from generative AI — could be a primary driver and determinant of growth and thus fiscal sustainability. If generative AI succeeds and the U.S. leads the way, it may be able to keep its head above water.


Jason Davis is an investment analyst with 10 years of industry experience (as of 12/31/2024). He holds a master's degree in economics from the London School of Economics and Political Science and a bachelor's degree in economics from the University of Nottingham.

Doug Kletter is an investment analyst with 13 years of industry experience (as of 12/31/2024). He holds dual bachelor's degrees in finance and economics from the University of Maryland graduating summa cum laude.

Arjun Madan is an investment analyst with 25 years of industry experience (as of 12/31/2024). He holds an MBA from the Wharton Business School and a bachelor's degree in commerce from the University of Delhi.


Bloomberg Global High Yield Corporate Index is a multi-currency flagship measure of the global high-yield debt market. The index represents the union of the U.S. High Yield, the Pan-European High Yield and Emerging Markets (EM) Hard Currency High Yield Indexes. The high-yield and emerging markets sub-components are mutually exclusive.


Bloomberg Emerging Markets Hard Currency Aggregate Index is a flagship hard currency Emerging Markets debt benchmark that includes USD, EUR and GBP-denominated debt from sovereign, quasi-sovereign and corporate EM issuers.


The Bloomberg Global Securitized Aggregate Index tracks securitized bonds from the flagship Global Aggregate Index.


The Bloomberg Global Aggregate Corporate Index is a flagship measure of global investment-grade, fixed-rate corporate debt. This multi-currency benchmark includes bonds from developed and emerging markets issuers within the industrial, utility and financial sectors.


The Bloomberg Global Treasury Index tracks fixed-rate, local currency government debt of investment-grade countries, including both developed and emerging markets. The index represents the treasury sector of the Global Aggregate Index and contains issues from 37 countries denominated in 24 currencies.

Our latest insights

RELATED INSIGHTS

Never miss an insight

The Capital Ideas newsletter delivers weekly insights straight to your inbox.

Investments are not FDIC-insured, nor are they deposits of or guaranteed by a bank or any other entity, so they may lose value.
Investors should carefully consider investment objectives, risks, charges and expenses. This and other important information is contained in the prospectuses and summary prospectuses, which can be obtained from a financial professional and should be read carefully before investing.
There have been periods when the results lagged the index(es) and/or average(s). The indexes are unmanaged and, therefore, have no expenses. Investors cannot invest directly in an index.
Source: Bloomberg Index Services Limited. BLOOMBERG® is a trademark and service mark of Bloomberg Finance L.P. and its affiliates (collectively "Bloomberg"). Bloomberg or Bloomberg's licensors own all proprietary rights in the Bloomberg Indices. Neither Bloomberg nor Bloomberg's licensors approves or endorses this material, or guarantees the accuracy or completeness of any information herein, or makes any warranty, express or implied, as to the results to be obtained therefrom and, to the maximum extent allowed by law, neither shall have any liability or responsibility for injury or damages arising in connection therewith.
Statements attributed to an individual represent the opinions of that individual as of the date published and do not necessarily reflect the opinions of Capital Group or its affiliates. This information is intended to highlight issues and should not be considered advice, an endorsement or a recommendation.
All Capital Group trademarks mentioned are owned by The Capital Group Companies, Inc., an affiliated company or fund. All other company and product names mentioned are the property of their respective companies.
Use of this website is intended for U.S. residents only.
Capital Client Group, Inc.
This content, developed by Capital Group, home of American Funds, should not be used as a primary basis for investment decisions and is not intended to serve as impartial investment or fiduciary advice.