International Equities
With the S&P 500 Index near record highs, have we moved past peak dominance for the Magnificent Seven ("Mag 7") group of stocks? It appears so, and it represents a healthy move away from the extreme concentration that raised concerns about risks to investor portfolios.
After three years of the Mag 7 accounting for a majority of the S&P 500’s annual return, more companies are now contributing; by September 30, non-Mag 7 stocks represented 59% of this year's return.
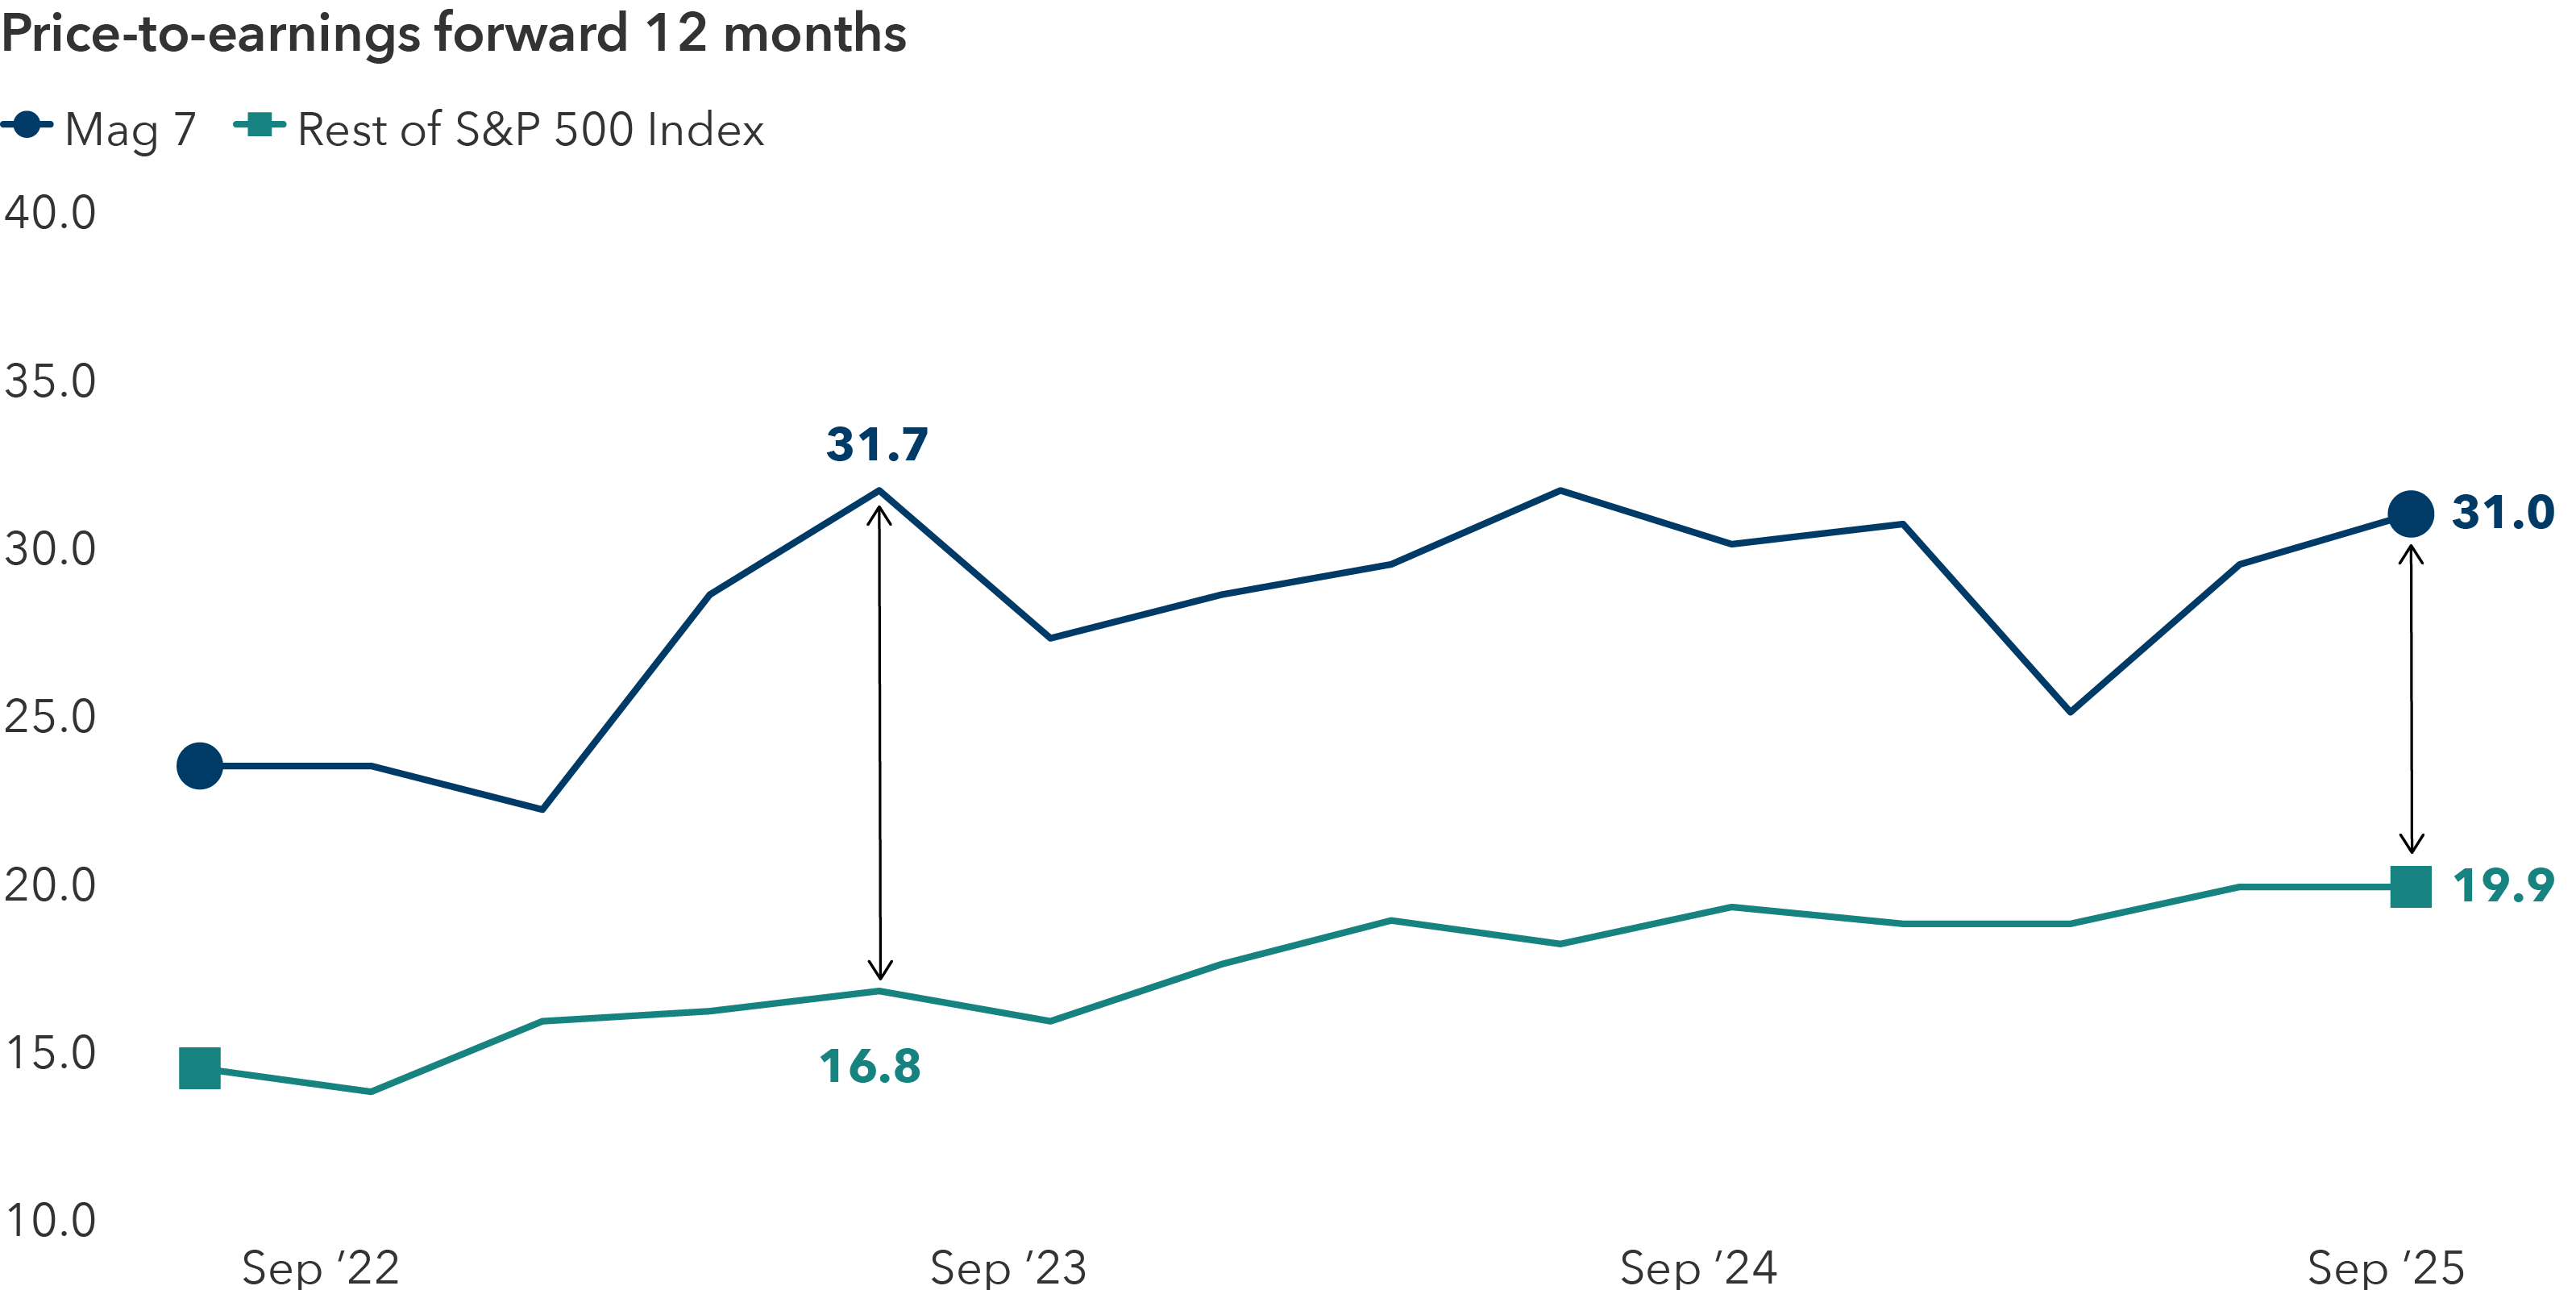
Fresh breadth may support the S&P 500’s rebound after its early 2025 selloff. The index has surged 36% since hitting an April 8 low. Rising valuations among companies in the index and more clarity on tariffs and interest rate cuts could help lift the U.S. equities market, which has trailed those in Europe and elsewhere.
“Heading into 2026, I think there are tailwinds that should drive earnings growth and support the market, such as stimulus from the tax bill and more policy certainty,” says Diana Wagner, equity portfolio manager at Capital Group. “There’s plenty of opportunity outside the Mag 7, and I think the broadening that we have started to see this year is going to continue.”
Market breadth is on the rise since touching a low in June 2023, when the Mag 7 dominated returns for the S&P 500.
On a rolling six-month basis through June 30, 2025, the percentage of stocks that notched higher returns than the Mag 7 median reached 51%, or 251 securities. That’s up from 1% in June 2023, representing just five companies.
Another telling sign: Since April 2, when the White House unveiled proposed tariffs on other countries, the percentage of stocks trading above their 200-day moving average climbed from 16% to 64% by the end of last month.
June 2023 marked peak concentration
Source: FactSet. The success rates below are based on six-month periods ending June 2023; December 2023; June 2024; December 2024; and June 2025, and represent the percentage of non-Mag 7 stocks in the S&P 500 Index which had a total return greater than the weighted average for the Mag 7 total return. Data as of June 30, 2025.
The meteoric rise of Nvidia, which has a near-monopoly on data center semiconductors fueling the AI boom, has catapulted the likes of Apple, Microsoft and Alphabet (parent of Google) to claim the title as the world’s most valuable company at $4.5 trillion.
Market breadth would potentially be wider if not for Nvidia’s dominance. Year to date through September 30, Nvidia contributed 20% of the S&P 500’s total return. Nvidia’s dominance flattened the impact of other Mag 7 stocks, barring Microsoft at 14%.
S&P 500 ex-Mag 7 are larger contributors to benchmark return
Source: FactSet. Rest of Mag 7 represents Alphabet, Amazon, Apple, Meta and Tesla. S&P 500 ex-Mag 7 represents the other 493 companies in the index. Data as of September 30, 2025.
After significant divergence two years ago, forward price-to-earnings parity is slowly increasing, indicating that long-term growth projections are edging closer. The Mag 7 stocks traded at 31 times forward earnings on a 12-month basis as of September 30 vs. 20 times for the other 493 companies.
“What appears to be unfolding is a stabilization in optimism for the Mag 7 and a pickup in confidence for the rest of the market,” says Steve Fox, a client portfolio solutions director at Capital Group. “Investors are demonstrating greater willingness to invest in the earnings potential of others.
“This suggests a more balanced risk/reward profile between mega-cap tech and the broader market, making valuation discipline increasingly important.”
Valuations outside Mag 7 have increased
Source: FactSet. The forward price-to-earnings (P/E) ratio is computed by dividing the stock price by the consensus forward 12-month earnings estimates. Forward P/E ratio for the Mag 7 is the market-cap weighted average. Data as of September 30, 2025.
Market pressures — like AI disruption, manufacturing slowdowns outside data center development and higher interest rates — have compressed valuations in some sectors.
Take companies whose stock prices have sold off on AI euphoria, such as information technology consulting firms and software providers. They could benefit from companies planning to incorporate agentic AI or harness data embedded in their software systems.
The AI investment cycle is expected to be massive, potentially growing the opportunity set of companies over the next several years.
Nvidia, for example, projects cumulative spending of $4 trillion by 2030. If so, the magnitude of spending could benefit select utilities that can support energy demand for data centers, along with semiconductor firms and lesser-known companies providing electrical, mechanical and plumbing equipment.
However, within industrials, the AI boom and tariff uncertainties have created a divergence in stock prices and valuations. Many end markets have struggled since 2023, and transportation, rental equipment and containerboard businesses are looking for efficiencies to improve margins.
“I’m interested in what I call self-help situations where companies can take steps to improve their margin structure. If successful, the return profile of these companies could look more attractive when growth resumes,” says Charles Ellwein, equity portfolio manager at Capital Group.
If the market continues to broaden, banks may take part, he adds. Regulators are weighing a plan to loosen capital requirements which could increase lending across industries. Banks have faced tighter restrictions since the 2008 financial crisis.
“I’m fairly diverse across sectors and not overly concentrated in my portfolios,” Ellwein says. “We could experience new breadth in the market, whether it be improving scenarios outside of AI-related companies or a rebound in the industrial economy. Market broadening is an ideal environment for stock pickers like me.”
Past results are not predictive of results in future periods.
The Magnificent Seven stocks consist of Alphabet, Amazon, Apple, Meta, Microsoft, NVIDIA and Tesla.
S&P 500 Index is a market capitalization-weighted index based on the results of approximately 500 widely held common stocks.
International Equities
International
Chart in Focus
Demographics & Culture
International Equities
RELATED INSIGHTS
The Capital Ideas newsletter delivers weekly insights straight to your inbox.