
July 2, 2025
KEY TAKEAWAYS
- Financial markets have been rocky over the past few months. Tariffs, federal layoffs, increased immigration enforcement and amplified partisan rhetoric have created a high degree of political and economic uncertainty in the U.S. and overseas. As uncertainty has increased, so has volatility – and so far, with no end in sight. Given all the anxiety that the past few months have created, how can investors adapt?
- One helpful strategy may be to consider a multi-sector approach to fixed income. The teams who manage these funds invest across multiple sectors of the bond market, which may include areas such as investment-grade corporates, high yield, securitized credit and emerging markets debt.
- By investing across a range of credit qualities, durations and geographic regions, a multi-sector approach may add resilience to an equity-focused portfolio or help income-focused investors who are seeking to outpace the yields that most core fixed income funds pursue.
To say the least, financial markets have been rocky over the past few months. Tariffs, federal layoffs, increased immigration enforcement and amplified partisan rhetoric have created a high degree of political and economic uncertainty in the U.S. and overseas. And of course, as uncertainty has increased, so has volatility – and so far, with no end in sight. Given all the anxiety that the past few months have created, how can investors adapt?
One helpful strategy may be to consider a multi-sector approach to fixed income. The teams who manage these funds invest across multiple sectors of the bond market, which may include areas such as investment-grade (BBB/Baa and above) corporates, high yield (BB/Ba and below), securitized credit and emerging markets debt. By investing in a range of issuers, industries, credit qualities, durations and geographic regions, multi-sector managers can potentially offer fixed income investors a high degree of diversification and liquidity across the bond market.
Capitalizing on flexibility and avoiding market timing
Given their broad mandate, multi-sector fixed income managers can typically pivot quickly and actively invest where they find the highest degree of relative value in the market. Over the long term, this flexibility can benefit investors by assuring that multi-sector funds stay invested across a range of U.S. and non-U.S. bonds that comprise a balanced, yet opportunistic portfolio. Just as importantly, a diversified portfolio can help fixed income investors avoid the trap of market timing sectors like high-yield or investment-grade corporates – a tempting, but potentially costly decision. At Capital Group, our flexible multi-sector approach utilizes deep fundamental research and our investment teams’ ability to spot areas of opportunity in markets that are often changing significantly by the minute.
Value emerges from chaos
Throughout the first half of 2025, equity and fixed income markets have produced gains and losses not seen since the onset of the COVID-19 pandemic, with daily volatility often at extreme levels. In the midst of that chaos, spreads on investment-grade corporates, high yield, securitized credit and emerging markets bonds have widened since the end of 2024.
Amid increased volatility, spreads have widened in many fixed income sectors
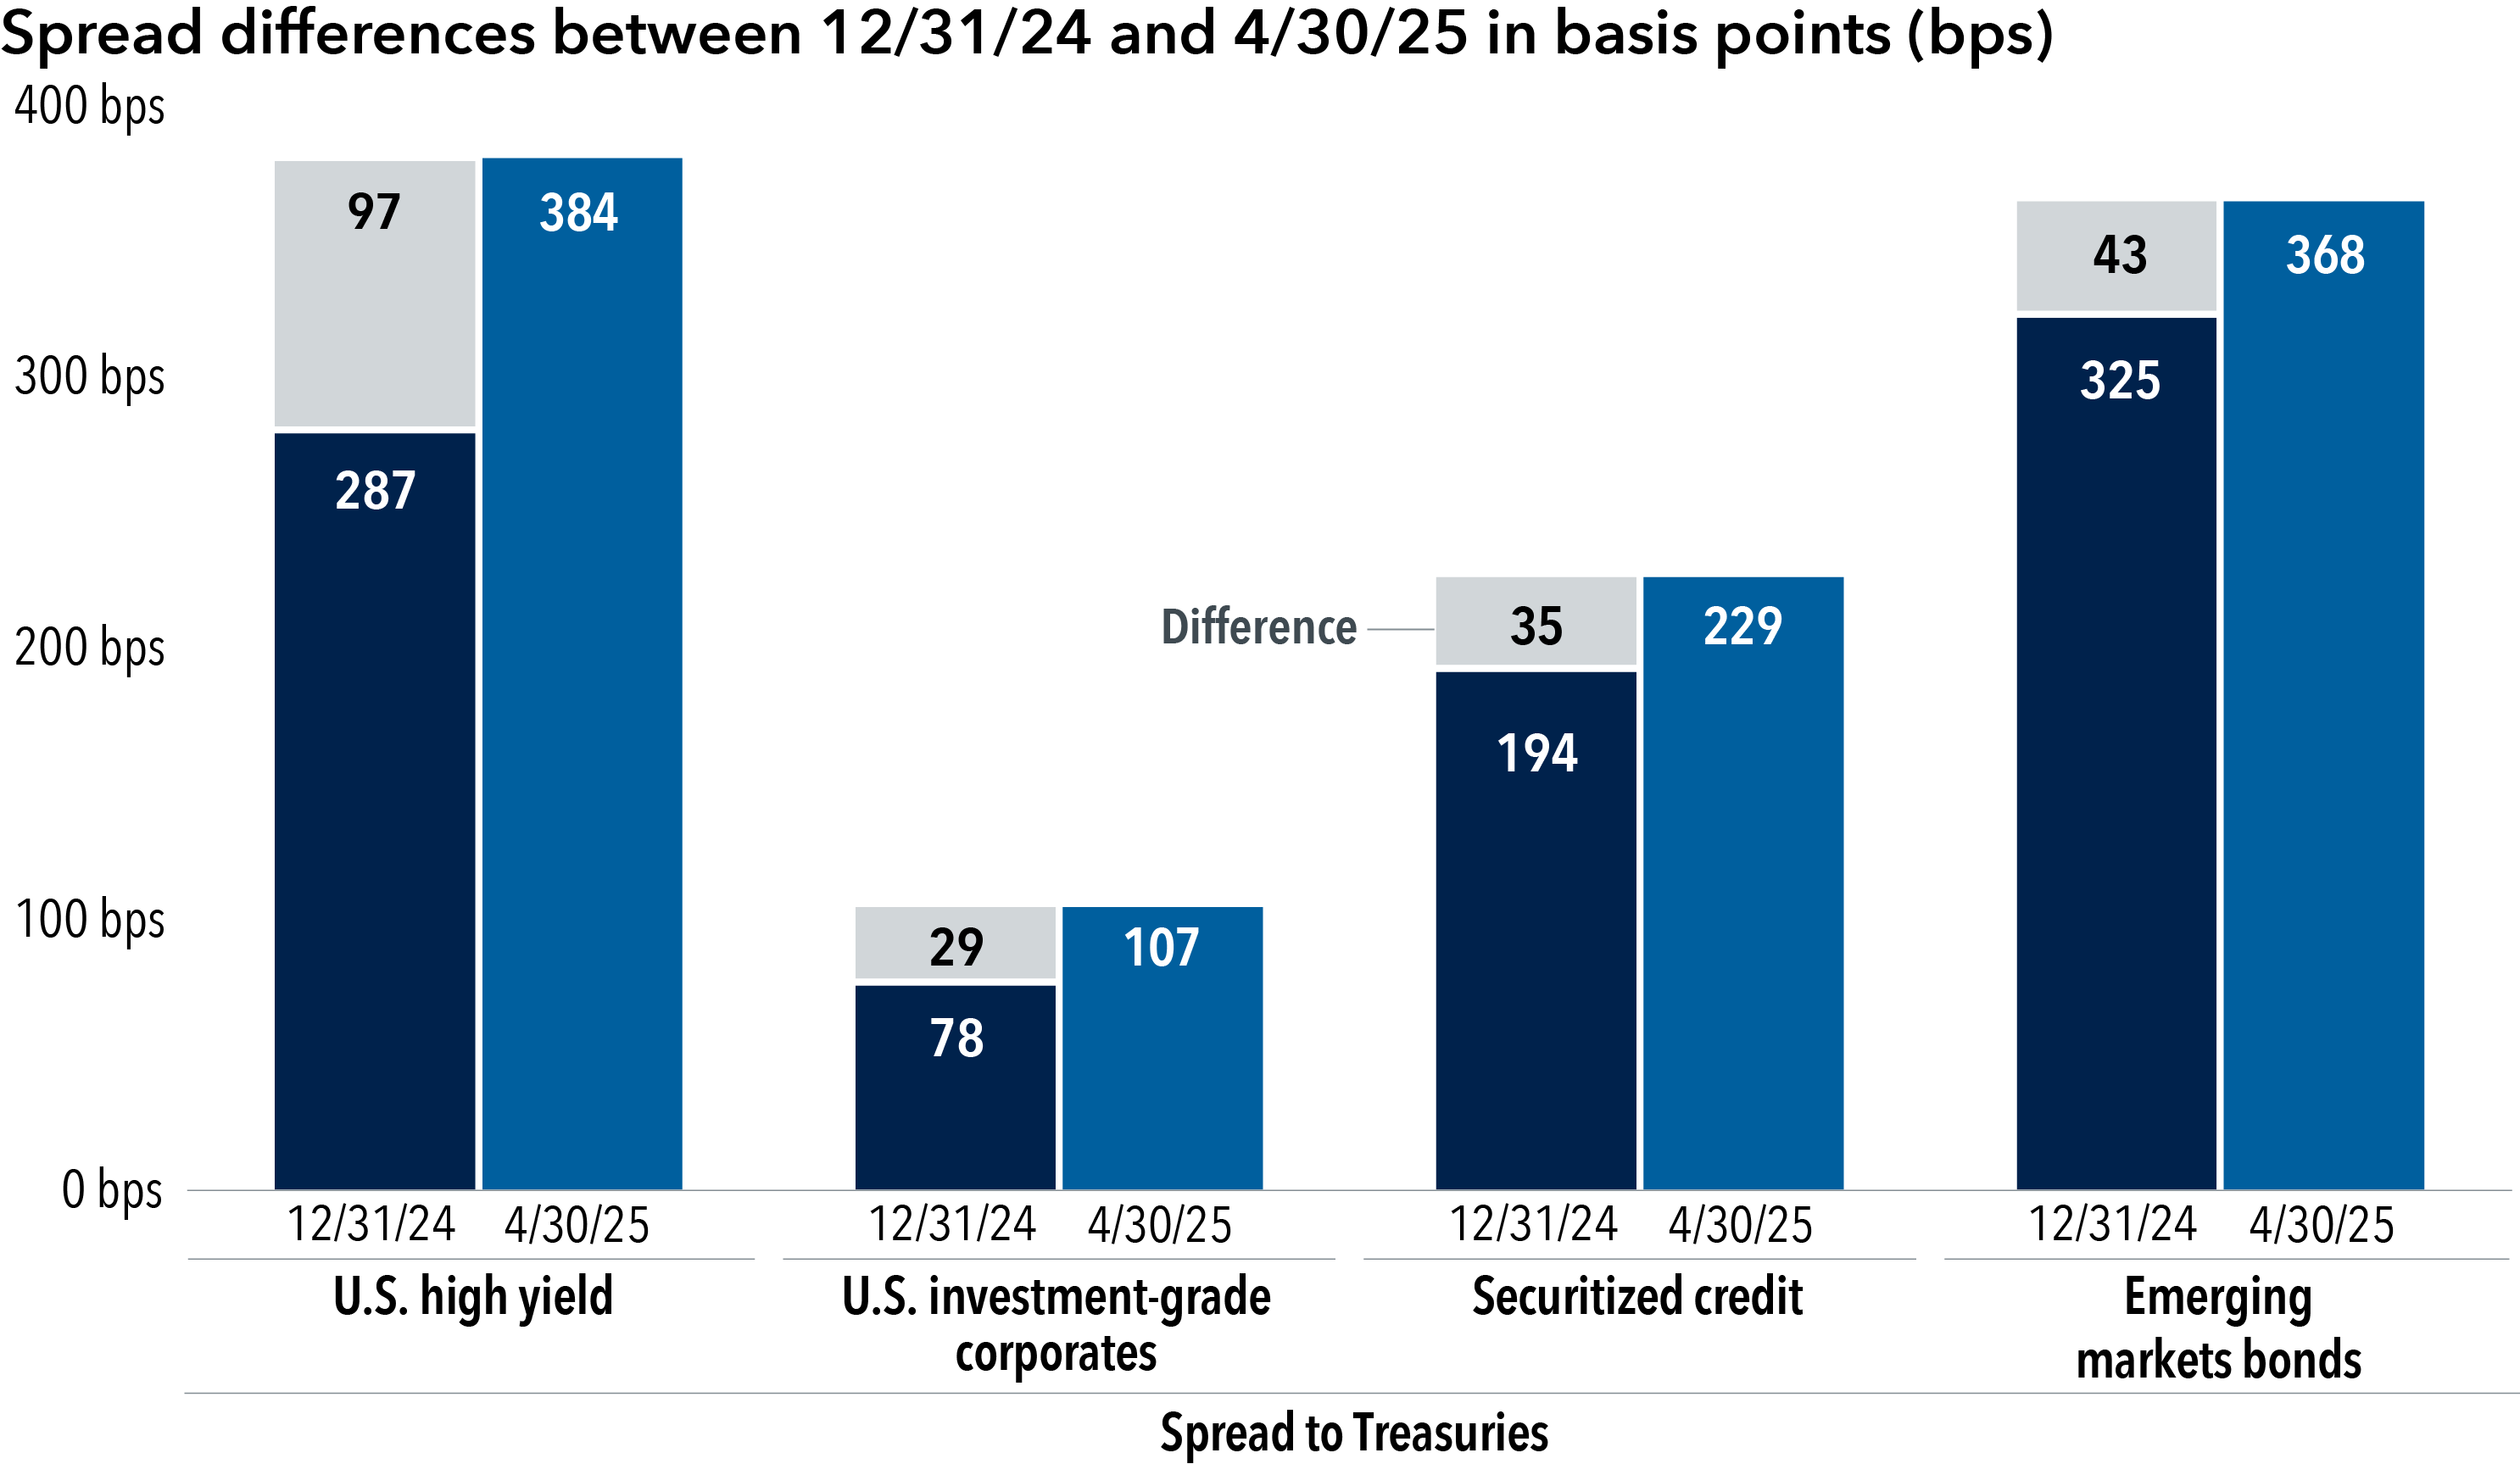
Source: Bloomberg. As of 4/30/25. Fixed income sectors are represented by the following indexes: U.S. high yield: the Bloomberg U.S. Corporate High Yield 2% Issuer Capped Index: U.S. investment-grade corporates: the Bloomberg U.S. Corporate Total Return Value Index; securitized credit: a 50/50 blend of the Bloomberg U.S. CMBS Non-Agency Ex-AAA Index and the Bloomberg U.S. ABS Ex-AAA Index; emerging markets bonds: the J.P. Morgan Emerging Market Bond Index Global Diversified. Spread to Treasuries is represented by the yield difference between the indexes noted above and the Bloomberg 3-7-Year U.S. Treasury Index.
Of course, as spreads widen, bond prices typically fall, meaning that multi-sector fixed income managers may now be in a better position to find relative value opportunities than they were only a few months ago. In turn, both equity and fixed income investors may be more able to take advantage of the potential diversification and liquidity benefits that a multi-sector approach to fixed income can offer. Meanwhile, American Funds’ Multi-Sector Income Fund (MIAYX; F-2 share class) has outpaced most of the component sectors of a multi-sector fixed income approach over the past five years. These sectors include U.S. high-yield bonds, U.S. investment-grade bonds, emerging markets debt, and a blend of asset-backed securities and commercial mortgage-backed securities.
MIAYX has outpaced most of the component sectors of a multi-sector fixed income approach
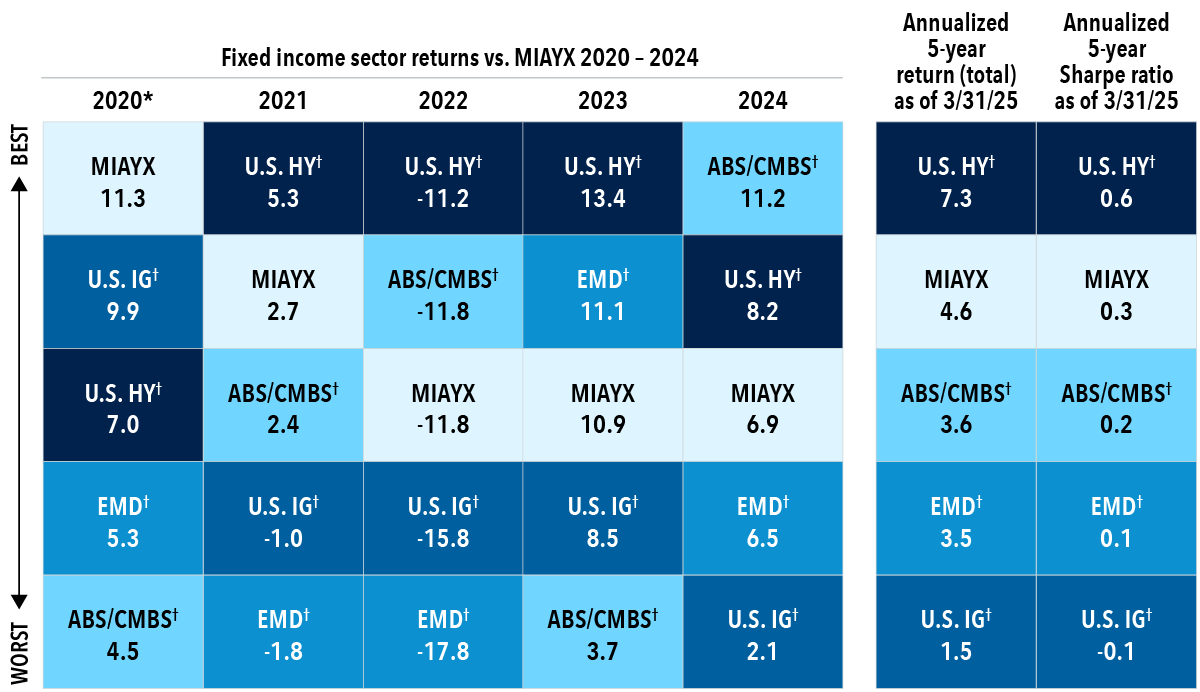
Sources: Bloomberg and Capital Group. As of 3/31/25. *Fund inception: March 22, 2019.
ABS = Asset-backed securities; CMBS = Commercial mortgage-backed securities; EMD = emerging markets debt; U.S. HY = U.S. high yield; U.S. IG = U.S. investment grade.
† Sectors shown are represented by the following indexes: U.S. HY: Bloomberg U.S. Corporate High Yield 2% Issuer Capped Index; U.S. IG: Bloomberg U.S. Corporate Investment Grade Index; EMD: J.P. Morgan Emerging Market Bond Index (EMBI) Global Diversified; ABS: Bloomberg U.S. ABS ex AAA Index; CMBS: Bloomberg U.S. CMBS ex AAA Index.
As we continue into 2025, bond yields across many sectors remain elevated relative to their five-year averages, even as the Federal Reserve appears set to continue lowering the federal funds target rate later this year. Against that backdrop, starting yields in sectors such as investment-grade corporates, high yield, securitized credit and emerging markets bonds have increased to levels that we believe are attractive. Not incidentally, some of these sectors have a relatively low correlation to equities, which may help equity investors decrease the overall beta (or relative volatility) of their portfolio. And while other sectors (such as high yield) may have a higher correlation to equities, their lower beta may still help decrease the overall volatility of an equity-focused portfolio.
Bond yields across many sectors remain elevated relative to their five-year averages
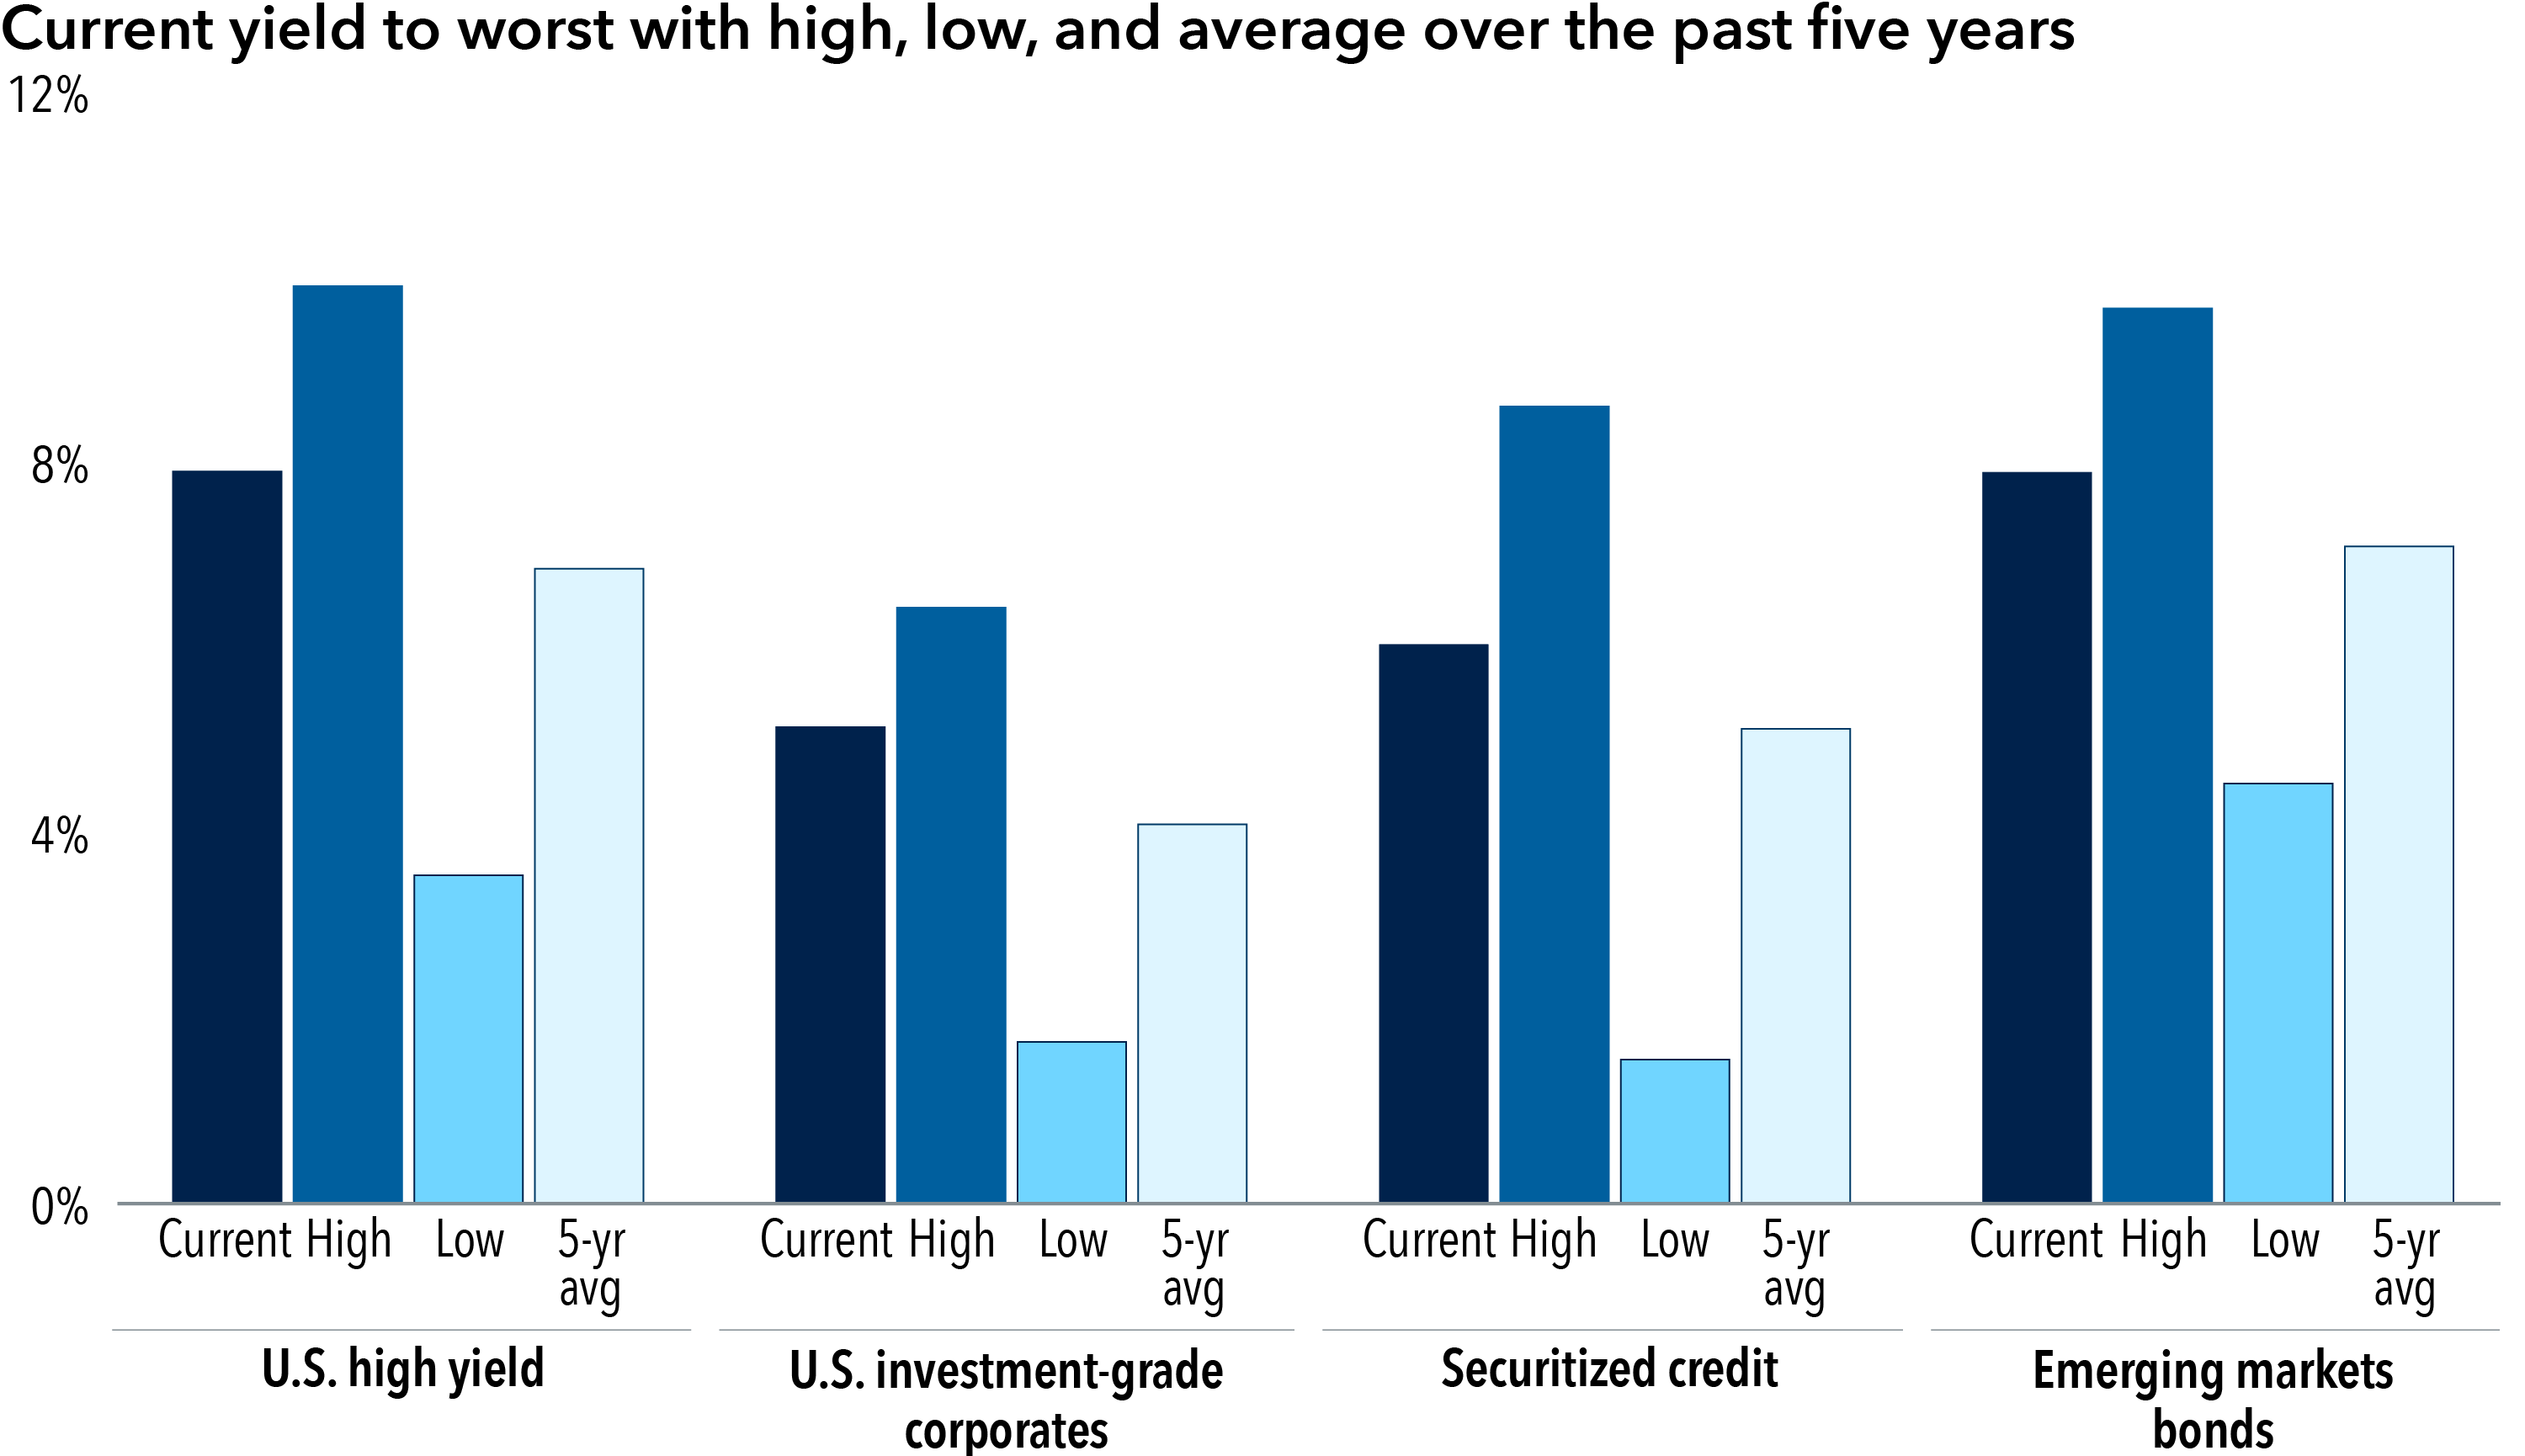
Source: Bloomberg. As of 4/30/25. Fixed income sectors are represented by the following indexes: U.S. high yield: the Bloomberg U.S. Corporate High Yield 2% Issuer Capped Index: U.S. investment-grade corporates: the Bloomberg U.S. Corporate Total Return Value Index; securitized credit: a 50/50 blend of the Bloomberg U.S. CMBS Non-Agency Ex-AAA Index and the Bloomberg U.S. ABS Ex-AAA Index; emerging markets bonds: the J.P. Morgan Emerging Market Bond Index Global Diversified.
Given these relatively high starting yields, we think it’s important to note that markets would have to sell off substantially for these sectors to produce negative total returns. In that sense, investors in these sectors may have something of a cushion against negative total returns as long as starting yields remain at or near these levels.
How our portfolio managers are adapting amid volatility
In the first quarter of 2025, our portfolio managers increased our multi-sector funds’ allocation to high yield to about 37% from 31% at year-end. We remain constructive on the high-yield sector, which in our view is supported by healthy fundamentals and strong technicals. We expect high-yield earnings growth to stay positive (though earnings may slow) and that gross new issuance will remain in check.
Our portfolio managers also modestly increased our multi-sector funds’ allocation to investment-grade corporates as spread widening provided an opportunity for a small relative value shift in positioning. More specifically, we increased our allocation to select technology and electricity issuers over the quarter. Meanwhile, we decreased our opportunistic allocation to agency mortgage-backed securities.
Securitized credit is still our multi-sector portfolios’ largest overweight conviction and remains toward the higher end of its historical allocation. Our portfolios’ commercial mortgage-backed securities (CMBS) allocation is still relatively evenly split between conduit and single-asset/single-borrower issuers. In our view, higher-quality CMBS remain attractive as compared to similarly rated corporate debt. Our strongest conviction within asset-backed securities continues to be subprime autos, and to a lesser extent, auto rentals.
Our multi-sector funds maintain their underweight to emerging markets bonds. Still, this allocation benefits from significant yield potential from its overweight to higher-yielding below-investment-grade sovereigns and its underweight to lower-yielding investment-grade sovereigns, which appear rich relative to other investment-grade sectors.
As uncertainty persists, the value of flexibility increases
With heightened market uncertainty likely to persist for some time, the value of flexibility becomes increasingly apparent. Of course, the worst-case scenario for investors is to be caught off guard in asset classes or sectors that unexpectedly lag the market. But perhaps the second worst-case scenario is for investors to hold concentrated positions and thereby miss upside returns in areas of the market that they may have overlooked. From that perspective, a multi-sector approach to fixed income can potentially help investors endure volatility without unduly sacrificing results. By investing across a range of credit qualities, durations and geographic regions, a multi-sector approach may add resilience to an equity-focused portfolio or help income-focused investors outpace the yields that most core fixed income funds seek to achieve. Ultimately, market volatility doesn’t have to be the enemy of returns, because in the midst of that uncertainty, unexpected opportunities may also appear.

Damien McCann is a fixed income portfolio manager with 26 years of investment industry experience (as of 12/31/2025). He holds a bachelor’s degree in business administration with an emphasis on finance from California State University, Northridge. He also holds the Chartered Financial Analyst® designation.

Scott Sykes is a fixed income portfolio manager with 24 years of experience (as of 12/31/2024). He holds an MBA in finance from the University of Pennsylvania, a master’s degree in international economics from the University of Essex, and a bachelor’s degree in both commerce and German from Washington and Lee University.