Are bonds back? Diversification returned amid volatility

Investors recently weathered the first major bout of equity volatility since the U.S. Federal Reserve pivoted toward rate cuts. The selloff, while unnerving, may have revealed a key insight of the post-rate hikes era: When stocks falter, bonds can help provide crucial balance.
 

The S&P 500 Index hit a record high in mid-February before slumping in March and plummeting in April, falling as much as 18.7% from its peak and nearing bear market territory. Investors shed riskier assets in response to the Trump administration’s announcement of sweeping tariffs on its global trading partners, a move that raised the specter of higher inflation and declining economic growth. Since then, the S&P 500 has fluctuated based on the latest in the administration’s tariffs plans and is down about 3.4% from its mid-February peak, as of May 30, with more volatility possibly ahead as plans unfold further.
 

While we are far from the conclusion of policy uncertainty, the behavior of bonds relative to stocks during these periods is notable. The Bloomberg U.S. Aggregate Index (Agg), a benchmark for the core bond market, returned about 1% in the period between the stock market’s mid-February peak and its recent low, as investors sought a measure of protection from rising recession risk. Its gains continued during the stock market rebound, with the Agg Index returning about 2.5% since mid-February, as of May 30. This flight to quality was also seen in an equity volatility period in the third quarter of 2024, when the S&P 500 fell by about 7.9% while the Agg Index returned 2.6%.  

As equities entered a correction, bonds provided a buffer

Line chart titled 'Cumulative returns (%)' comparing the Bloomberg U.S. Aggregate Index and the S&P 500 Index from February 19, 2025, to April 8, 2025. The Bloomberg U.S. Aggregate Index consistently stays above 0% throughout the period, beginning at 0% and ending at 1%. The S&P 500 begins at 0% and remains negative before a sharp decline in early April to end at 18.7%.

Source: Bloomberg. As of 4/8/25. A correction is defined as a price decline of 10% or more (without dividends reinvested) in the S&P 500 Index with at least 75% recovery. 

The performance marks a turnaround from what investors experienced in equity corrections in 2022 and 2023. During that period, soaring inflation prompted the Fed to increase rates an eyewatering 5.25 percentage points over 16 months, delivering a significant blow to fixed income returns. As bonds fell in tandem with stocks, some investors were left questioning the value of a traditional 60/40 portfolio (shorthand for a diversified portfolio built with 60% equities and 40% fixed income).

Bond ballast appears to be making a comeback

Bar chart titled "Average cumulative returns (%)" that compares the S&P 500 and Agg performance across three periods. During "Equity corrections from 2010–2021," the S&P 500 returned -17.4% and the Agg returned 1.4%. In "Equity corrections from 2022–2023," the S&P 500 returned -17.2% and the Agg returned -9.4%. For "Policy uncertainty February to April 2025” the S&P 500 returned -18.7% and the Agg returned 1.0%.

Sources: Capital Group, Morningstar, Bloomberg. Data as of 4/8/25. For equity correction periods in 2010-2023, figures were calculated by using the average cumulative returns of the indexes during the nine equity market correction periods since 2010. Corrections are based on price declines of 10% or more (without dividends reinvested) in the S&P 500 Index with at least 75% recovery. The cumulative returns are based on total returns. Ranges of returns for the equity corrections measured: S&P 500 Index: -34% to -10%; Bloomberg U.S. Aggregate Index: -14% to 5%. The dates of the 2025 correction are 2/19/25 to 4/8/25.

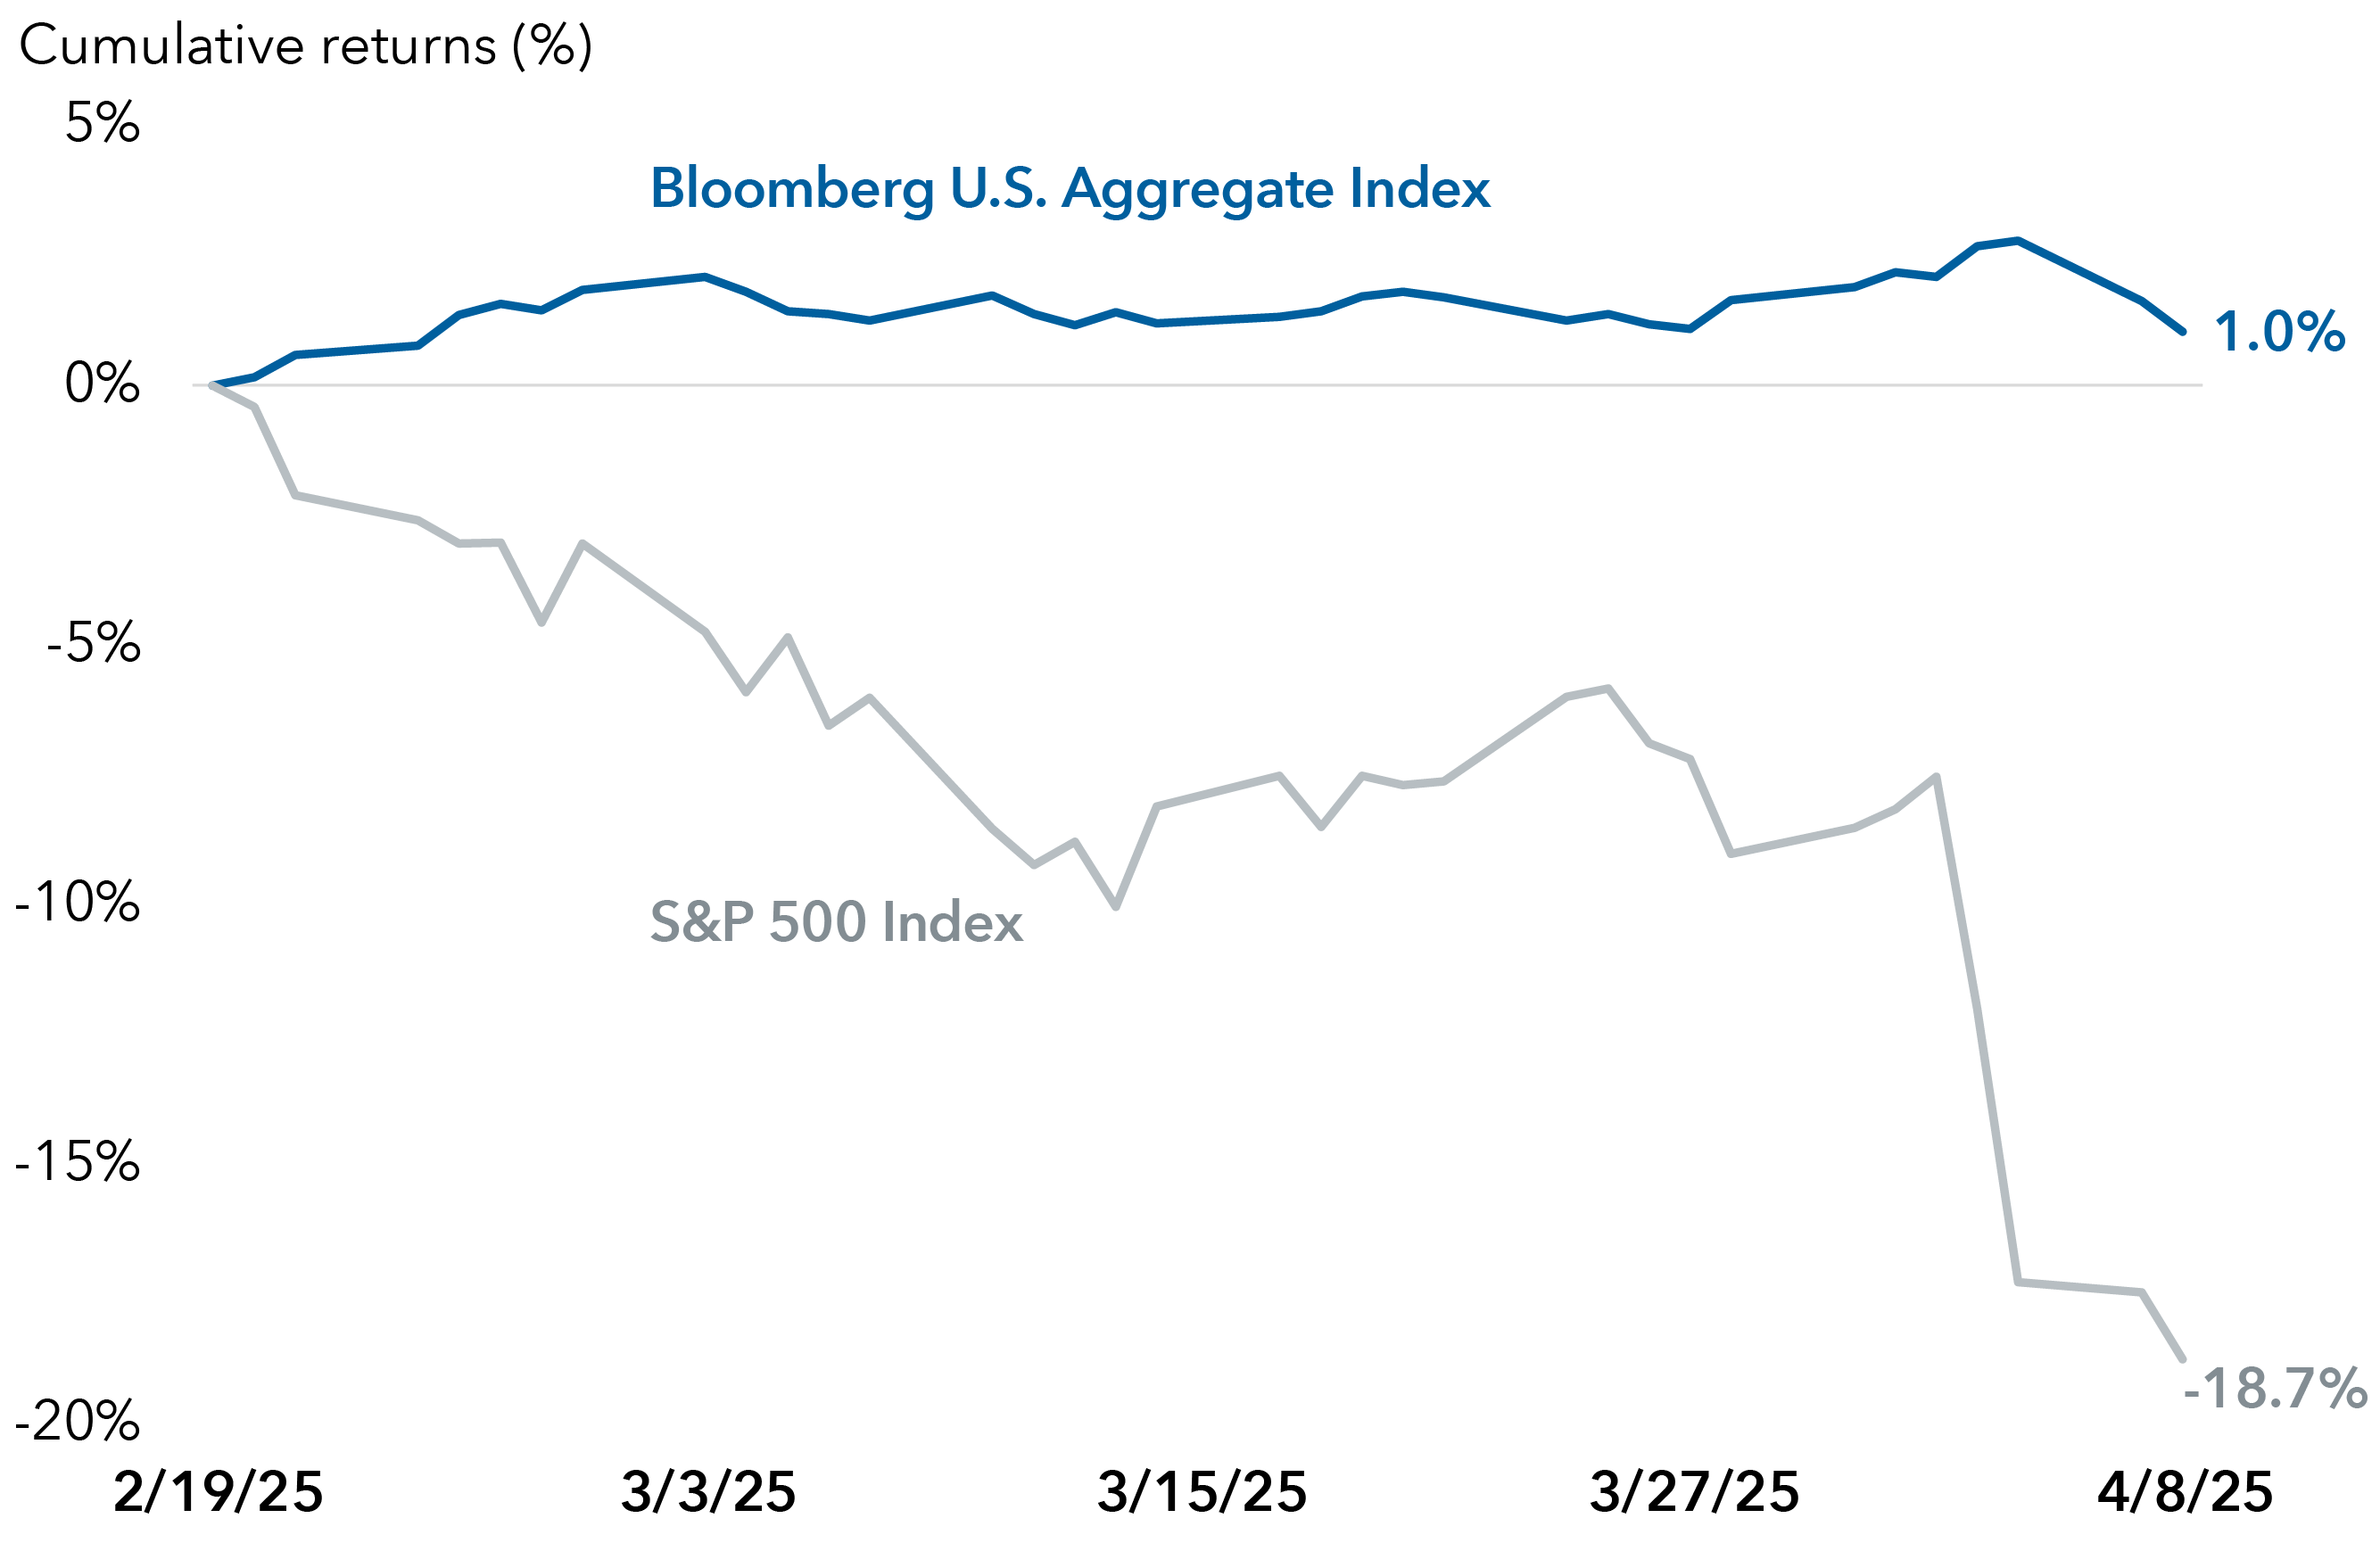
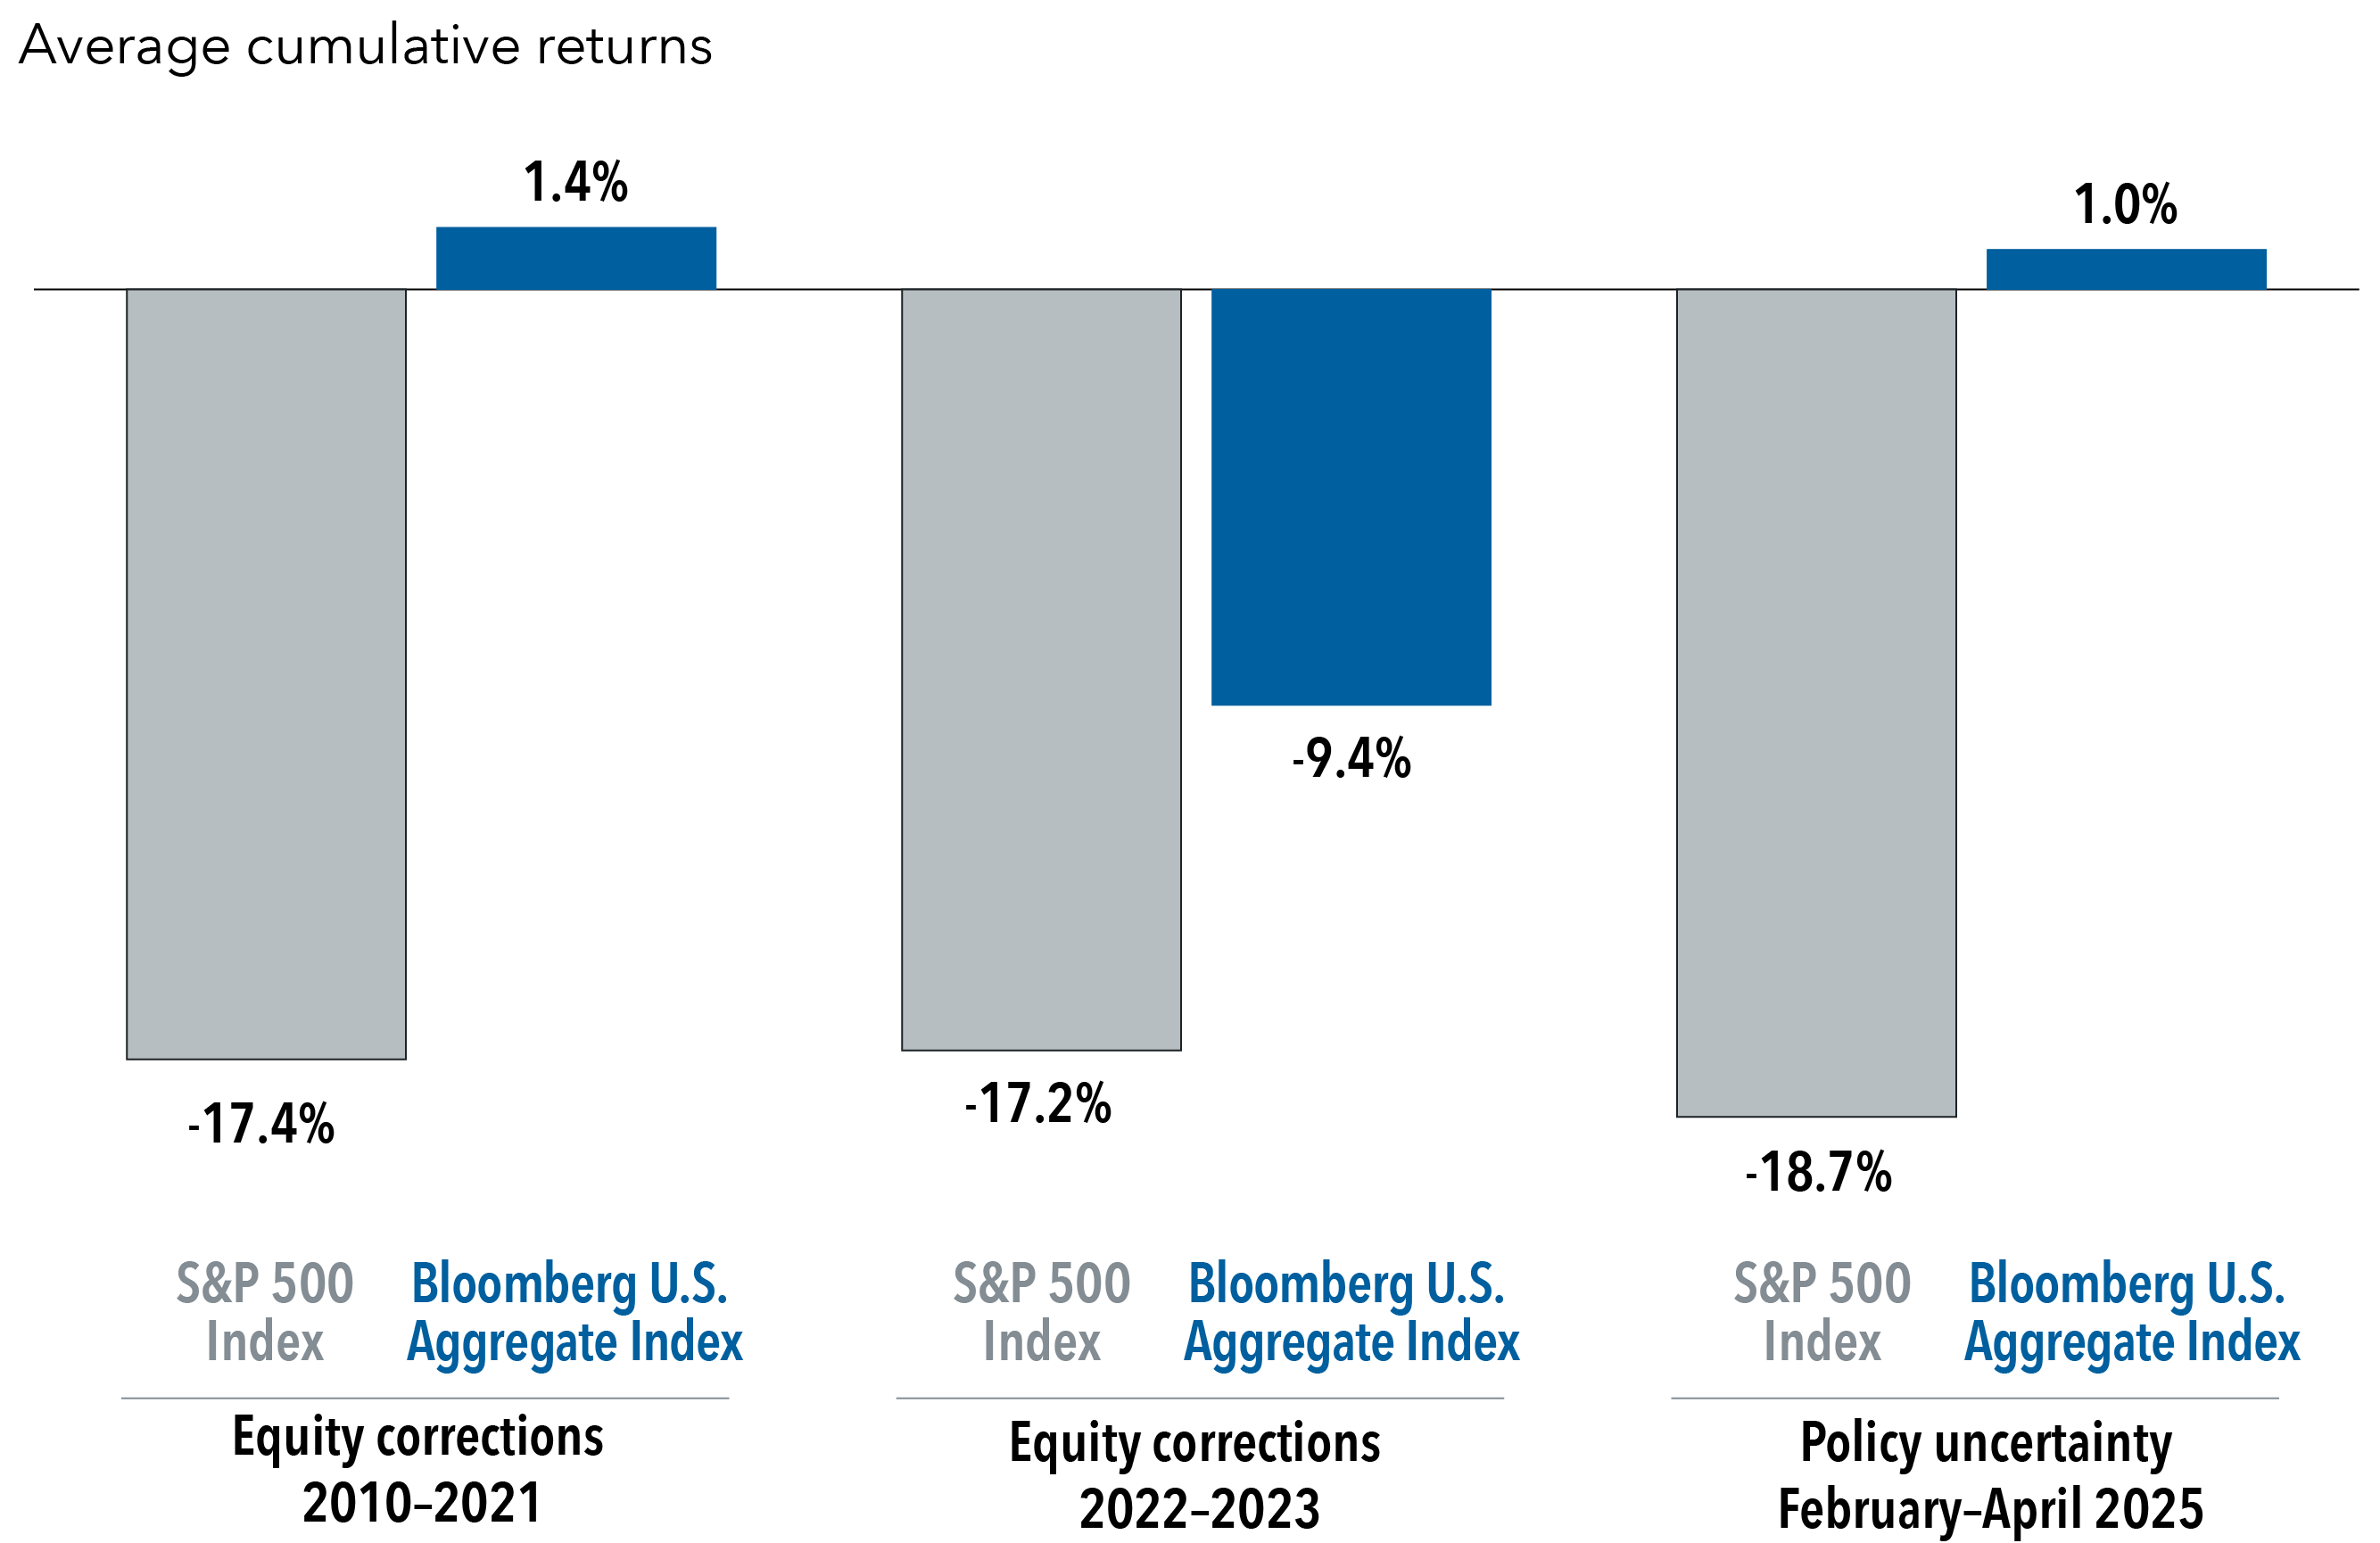
With the latest correction, investors may now be seeing the return of the traditional, negative correlation between stocks and bonds. Inflation has been tamed, with the Consumer Price Index dropping from 9.1% in June 2022 to 2.3% in April, following the Fed’s rate hiking campaign — a major driver behind the breakdown in bond diversification. While markets are watching for any uptick in inflation from tariffs, the Fed’s response will likely be influenced by whether those increases are transitory and the potential hit to economic growth.
 

A silver lining of the Fed’s rate hikes was to lift bond yields off their near rock-bottom lows. Yields on the Agg Index have reached about 4.7% as of May 30, compared with roughly 2% prior to the Fed’s hikes and a 10-year average of about 3%. Those elevated yields are now serving as a cushion, helping bonds weather interest rate volatility.
 

Bonds remained resilient even as the Fed remained on pause following its latest rate reduction in December 2024. Investors are wagering that the Fed’s next move will be to resume rate cuts, which could help further boost bond returns. As of May 30, futures markets indicate a 66% probability of a Fed rate cut in 2025, compared with a 4% chance of a rate hike and a 30% likelihood of an extended pause. The Fed is projecting two more 25 basis point cuts later this year, according to its most recent March projections, with Fed chairman Jerome Powell stating that the Fed “can afford to be patient as things unfold,” at a press conference on May 7, 2025.
 

Not everyone is on the bond bandwagon. The recent equity selloff caused some portions of the bond market to come under pressure. Risk premiums, especially for longer term Treasuries, were impacted by the unwinding of trades by hedge funds and speculation that foreign investors might diversify out of U.S. assets. Moody’s downgrade of U.S. sovereign debt, from Aaa to Aa1 in mid-May, also added to investor qualms.
 

Despite these concerns, the narrative of a vast exodus from U.S. Treasuries appears to be overstated. The Treasury market remains the largest and most liquid government bond market in the world, with a lack of large, liquid alternatives elsewhere. The Fed also has several tools at its disposal to provide liquidity and support market functioning. While the Moody’s downgrade may inject fresh urgency into the discussion around the federal deficit, forced selling of Treasuries is unlikely as Moody’s is the third ratings agency to downgrade the U.S. and investors have had ample time to digest the implications.
 

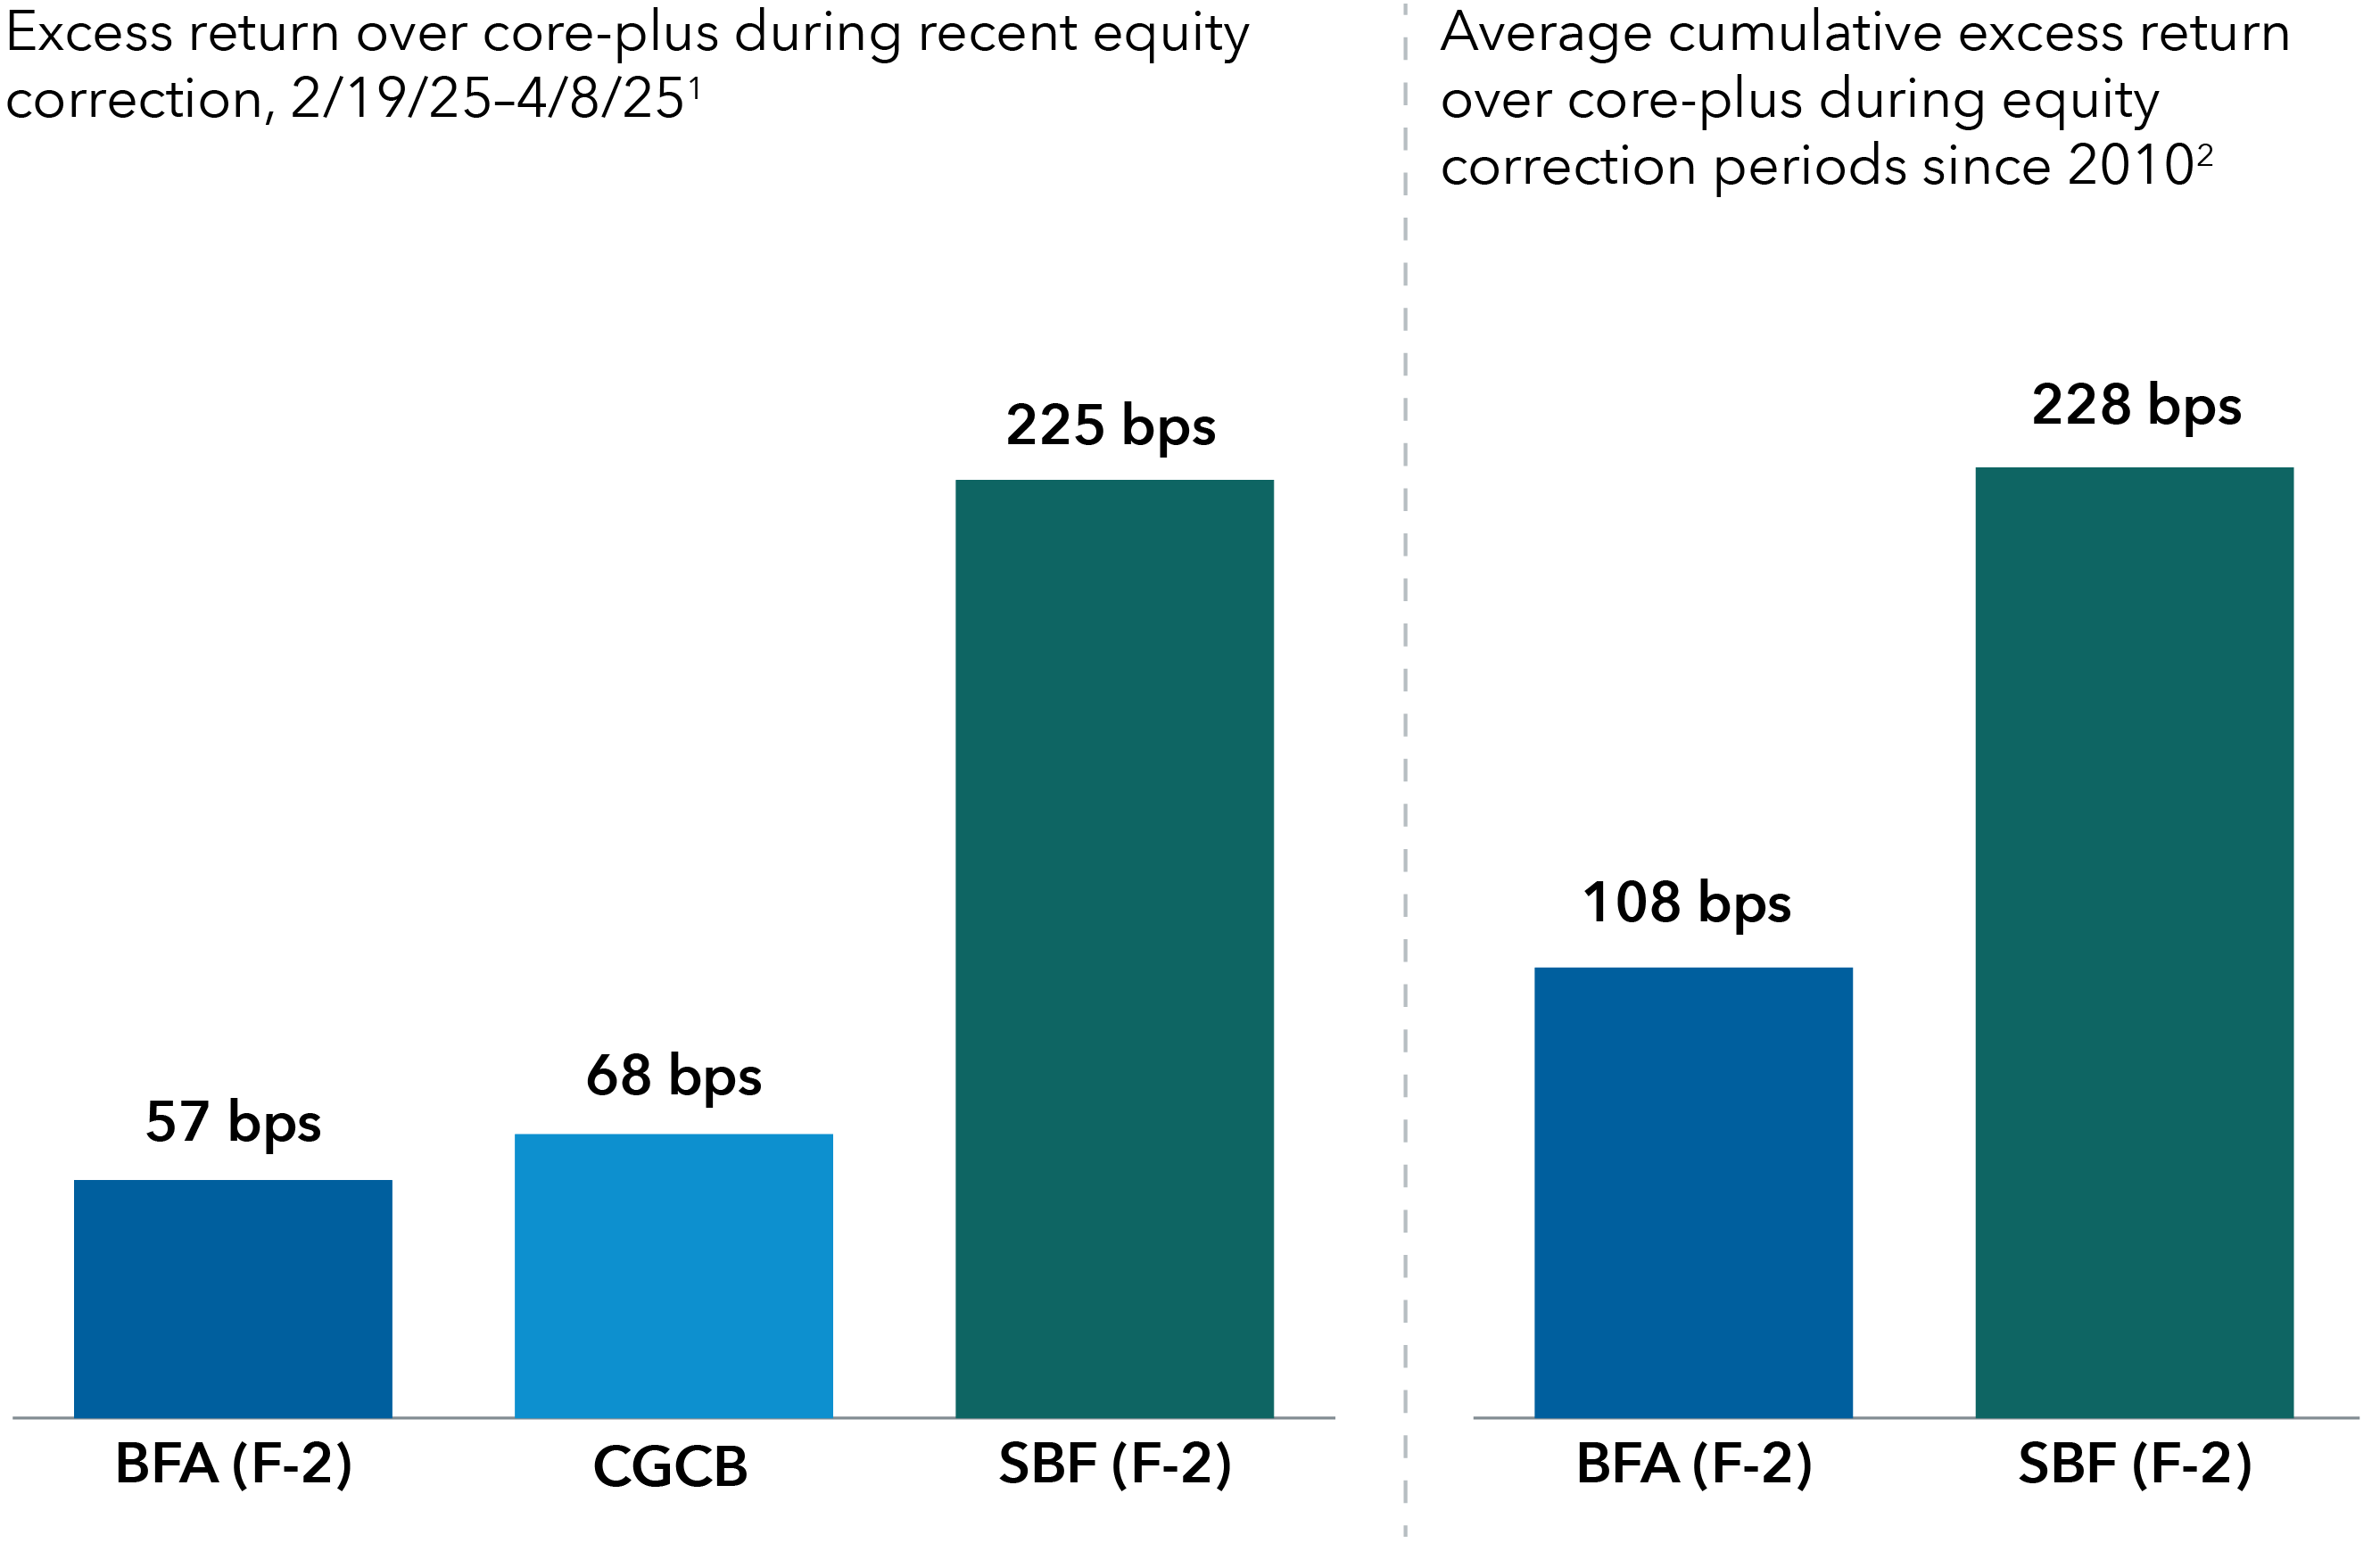
Amid these various crosswinds, a focus on quality and interest rate positioning appears key for bond investors.  The Bond Fund of America® (BFA), our true core bond offering, and American Funds® Strategic Bond Fund (SBF), part of our core-plus suite, have posted positive returns and outperformed the Morningstar Intermediate Core-Plus bond category in the latest volatility period. The category is comprised of some core plus funds which may take on additional credit risk in the hopes of boosting returns.
 

As equities fell from their mid-February peak to their early April low, BFA and SBF posted returns that outstripped average returns on the core-plus category by 57 and 225 basis points (bps), respectively. Meanwhile CGCB - Capital Group Core Bond ETF, an active ETF launched in 2023, posted excess returns relative to the core-plus category of 68 bps during that timeframe. When looking at equity correction periods since 2010, BFA and SBF also had strong average excess returns over the core-plus category. 

BFA, SBF and CGCB have outpaced credit-driven categories during equity corrections

Two bar charts shown. The chart on the left shows excess returns over core-plus during the equity correction period, from 2/19/25 to 4/8/25, with BFA F-2 shares posting excess returns of 57 basis points, CGCB posting excess returns of 68 basis points and SBF F-2 shares posting excess returns of 225 basis points. The chart on the right shows average cumulative excess return over core-plus during equity correction periods since 2010, with BFA F-2 shares posting excess returns of 108 basis points and SBF F-2 shares posting excess returns of 228 basis points.

Sources: Capital Group, Morningstar. Data as of 4/8/25.

1Excess returns calculated relative to the Morningstar Intermediate Core-Plus Bond category, which returned 0.47% during the period. The S&P 500 Index lost 18.7% over the period.

2Averages were calculated by using the cumulative returns of funds versus the Morningstar Intermediate Core-Plus Bond category during the 10 equity market correction periods since 2010, except for SBF — the calculation for which only includes six periods after its March 2016 inception. CGCB is excluded from the chart as it hasn’t experienced multiple correction periods since its September 2023 inception. Corrections are based on price declines of 10% or more (without dividends reinvested) in the unmanaged S&P 500 with at least 75% recovery. The cumulative returns are based on total returns. Ranges of returns for the equity corrections measured: The Bond Fund of America: -14.07% to 3.41%; American Funds Strategic Bond Fund: -14.46% to 3.04%; Morningstar Intermediate Core-Plus Bond category: -14.73% to 2.25%; S&P 500 Index: -33.79% to -9.94%. There have been periods when the funds have lagged the categories and the index, such as in rising equity markets. 

In terms of approach, BFA maintains a quality-oriented portfolio that utilizes multiple return drivers and aims to provide diversification from equities. SBF is structured with a rates-driven approach that takes an opportunistic approach to credit and seeks low correlation to equities.
 

Coming into 2025, a few key themes were beginning to take shape: increased influence from government policy, elevated rate volatility and the potential for stock-bond correlations to revert to historical norms. While tariffs might have been an unexpected catalyst, these themes appear to be unfolding and reshaping the investment landscape. Fixed income may prove attractive amid these shifts, as headwinds from rising rates have transformed into tailwinds during the Fed’s cutting cycle. Bonds appear to have reclaimed their role as a diversifier in investor portfolios, helping to provide a level of stability during uncertain times. 
 

margaret-steinbach-color-600x600

Margaret Steinbach is the asset class lead for fixed income and oversees the team of investment directors in North America. She has 18 years of investment industry experience (as of 12/31/2024). She holds a bachelor’s degree in commerce from the University of Virginia.

CTHM_Headshot

Catherine Magyera is a senior investment product manager with 18 years of industry experience (as of 12/31/2024). She holds a bachelor's degree in history from University of Pennsylvania. 


Total Returns (%) for indexes and categories

As of 4/30/251-year cumulative5-year average annualized10-year average annualized
Bloomberg U.S. Aggregate Index8.02-0.671.54
Morningstar Intermediate Core-Plus Bond Category Average8.030.521.8
S&P 500 Index12.115.6112.32

Explore new fixed income funds

Find out how Public–Private+ Funds can fit in with your fixed income allocation. 

Read all perspectives on bond markets

Figures shown are past results and are not predictive of results in future periods. Current and future results may be lower or higher than those shown. Investing for short periods makes losses more likely. Prices and returns will vary, so investors may lose money. View mutual fund expense ratios and returns. View ETF expense ratios and returns. View current mutual fund SEC yields.

Investments are not FDIC-insured, nor are they deposits of or guaranteed by a bank or any other entity, so they may lose value.
Investors should carefully consider investment objectives, risks, charges and expenses. This and other important information is contained in the ETF prospectuses and summary prospectuses, which can be obtained from a financial professional and should be read carefully before investing. This and other important information is contained in the mutual fund prospectuses and summary prospectuses, which can be obtained from a financial professional and should be read carefully before investing.
Capital Group exchange-traded funds (ETFs) are actively managed and do not seek to replicate a specific index. ETF shares are bought and sold through an exchange at the then current market price, not net asset value (NAV), and are not individually redeemed from the fund. Shares may trade at a premium or discount to their NAV when traded on an exchange. Brokerage commissions will reduce returns. There can be no guarantee that an active market for ETFs will develop or be maintained, or that the ETF's listing will continue or remain unchanged.
The use of derivatives involves a variety of risks, which may be different from, or greater than, the risks associated with investing in traditional securities, such as stocks and bonds.
Lower rated bonds are subject to greater fluctuations in value and risk of loss of income and principal than higher rated bonds.
The return of principal for bond portfolios and for portfolios with significant underlying bond holdings is not guaranteed. Investments are subject to the same interest rate, inflation and credit risks associated with the underlying bond holdings.
Frequent and active trading of American Funds Strategic Bond Fund's portfolio securities may occur, which may involve correspondingly greater transaction costs, adversely affecting the results.
Investing outside the United States involves risks, such as currency fluctuations, periods of illiquidity and price volatility. These risks may be heightened in connection with investments in developing countries.
Nondiversified funds have the ability to invest a larger percentage of assets in the securities of a smaller number of issuers than a diversified fund. As a result, poor results by a single issuer could adversely affect fund results more than if the fund invested in a larger number of issuers. See the applicable prospectus for details.
There have been periods when the results lagged the index(es) and/or average(s). The indexes are unmanaged and, therefore, have no expenses. Investors cannot invest directly in an index.
Source: Bloomberg Index Services Limited. BLOOMBERG® is a trademark and service mark of Bloomberg Finance L.P. and its affiliates (collectively "Bloomberg"). Bloomberg or Bloomberg's licensors own all proprietary rights in the Bloomberg Indices. Neither Bloomberg nor Bloomberg's licensors approves or endorses this material, or guarantees the accuracy or completeness of any information herein, or makes any warranty, express or implied, as to the results to be obtained therefrom and, to the maximum extent allowed by law, neither shall have any liability or responsibility for injury or damages arising in connection therewith.
Each S&P Index ("Index") shown is a product of S&P Dow Jones Indices LLC and/or its affiliates and has been licensed for use by Capital Group. Copyright © 2025 S&P Dow Jones Indices LLC, a division of S&P Global, and/or its affiliates. All rights reserved. Redistribution or reproduction in whole or in part is prohibited without written permission of S&P Dow Jones Indices LLC.
All Capital Group trademarks mentioned are owned by The Capital Group Companies, Inc., an affiliated company or fund. All other company and product names mentioned are the property of their respective companies.
Use of this website is intended for U.S. residents only. Use of this website and materials is also subject to approval by your home office.
Capital Client Group, Inc.
This content, developed by Capital Group, home of American Funds, should not be used as a primary basis for investment decisions and is not intended to serve as impartial investment or fiduciary advice.
© 2025 Morningstar, Inc. All Rights Reserved. Some of the information contained herein: (1) is proprietary to Morningstar and/or its content providers; (2) may not be copied or distributed; and (3) is not warranted to be accurate, complete or timely. Neither Morningstar, its content providers nor Capital Group are responsible for any damages or losses arising from any use of this information. Past performance is no guarantee of future results. Information is calculated by Morningstar. Due to differing calculation methods, the figures shown here may differ from those calculated by Capital Group.

Bond ratings, which typically range from AAA/Aaa (highest) to D (lowest), are assigned by credit rating agencies such as Standard & Poor's, Moody's and/or Fitch, as an indication of an issuer's creditworthiness. If agency ratings differ, a security will be considered to have received the highest of those ratings, consistent with applicable investment policies. Securities in the Unrated category have not been rated by any of the rating agencies referenced above; however, the investment adviser performs its own credit analysis and assigns comparable ratings that are used for compliance with applicable investment policies.


Statements attributed to an individual represent the opinions of that individual as of the date published and do not necessarily reflect the opinions of Capital Group or its affiliates. This information is intended to highlight issues and should not be considered advice, an endorsement or a recommendation.


Consumer Price Index (CPI) is a measure of the average change over time in the prices paid by urban consumers for a market basket of consumer goods and services.


The Bloomberg U.S. Aggregate Index measures the performance of the investment-grade, USD-denominated, fixed-rate taxable bond market.


The S&P 500 Index is a market capitalization-weighted index based on the results of approximately 500 widely held common stocks.