Market Volatility
Categories
Currencies
Is the U.S. dollar bull run over?
 Jens Søndergaard
May 29, 2025
The dollar has lost ground against major currencies so far this year, prompting questions as to whether the dollar’s multi-year bull run is coming to an end. About a month after "Liberation Day," the U.S. dollar has shown signs of stabilization, though it continues to soften against most developed and emerging markets currencies. Here’s my latest thinking on what factors could cause sustained weakness in the dollar.
Prolonged dollar weakness requires a growth slowdown
Year-to-date, the dollar has declined 8% against the euro and yen and 6% against the pound. It’s also fallen against many emerging markets currencies, notably the Mexican peso and Brazilian real.
For the dollar to enter a prolonged period of decline, we would need to see either U.S. growth sharply weaken or growth in the rest of the world pick up strongly.
U.S. growth could decline through policy uncertainty. While tariffs do not normally cause currency weakness for the country imposing them, unpredictable tariffs that leave businesses hesitant to make long-term investment decisions might. We can already see evidence of a slowdown in U.S. growth momentum, although the risks of a recession have now likely diminished, in light of negotiations with China.
Another way to achieve sustained weakness in the dollar is by an increase in growth trends in other parts of the world. As illustrated in the chart, the gap between U.S. and European growth appears to be narrowing for 2025, but we would need the relative growth trend to change to really see a reversal of the dollar bull cycle.
Global growth differentials are now less bullish on USD

Sources: Capital Strategy Research, Macrobond. Data from March 1, 2023, to May 21, 2025.
European rates have generally been low due to secular stagnation, but the recent announcement of German stimulus combined with the EU’s plan to raise defence spending should pave the way for closer European integration and faster growth in the coming years. That said, it’s not clear whether German defence spending will lead to broad-based European structural growth. And even if it does, it might not happen for a few years.
China’s economy, another engine of growth worldwide, has yet to show a pickup in momentum. China has started to stabilize, although stimulus remains limited. That trend could change as Chinese officials look toward more fiscal measures to offset tariff risks.
What can real rates and growth tell us?
As seen in the chart below, the dollar’s actual performance has been much more closely tied to cyclical factors including growth and real interest rates. The two are connected as interest rate differentials between countries generally reflect a difference in growth and inflation between economies, with stronger growth generally leading to higher interest rates.
10-year U.S. Treasury has been correlated to the dollar
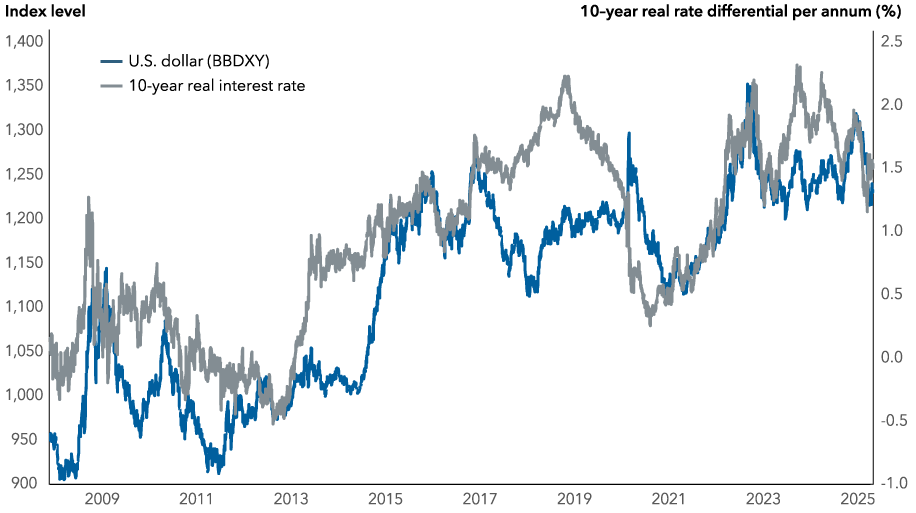
Sources: Capital Strategy Research, Macrobond. BBDXY = The Bloomberg Dollar Spot Index. Data from January 1, 2008, to May 15, 2025. The 10-year real interest rate is the U.S. minus Germany, Japan and U.K. weighted average.
Fundamental valuations suggest the dollar is overvalued
Several longer term models attempt to value the dollar, using trends in productivity, demographics, inflation and any fundamental changes in the economy. These models, including our own, generally all show that the dollar is overvalued.
The purchasing power parity (PPP) theory, for example, suggests exchange rates between currencies are in equilibrium when their purchasing power is the same in each of the two countries. PPP has helped explain broad trends in the dollar’s performance, but it has rarely actually traded in line with expected valuations.
Will the greenback’s overvaluation subside more?

Sources: Capital Strategy Research, J.P. Morgan. The real broad effective exchange rate measures the value of the U.S. dollar against a group of developed and emerging markets currencies and adjusts for inflation using the Consumer Price Index (CPI). CPI is a commonly used measure of inflation that measures the average change over time in the prices paid by consumers for a basket of goods and services. Data from January 1, 1980, to April 1, 2025.
Factors that drove the dollar’s rise
Over the past decade, global demand for U.S. equities, particularly large technology stocks, bolstered the strength of the U.S. dollar. A significant portion of that capital came from Japan and Europe, regions characterized by low interest rates, sluggish economic growth and certain policies that discouraged investors. Solid returns from U.S. assets have also drawn passive investors, such as sovereign wealth funds, and curbed capital outflows from the U.S. to emerging markets (EM). Meanwhile, during periods of heightened risk aversion, investors have sought the security of U.S. Treasuries.
Measures such as tariffs and tax cuts were expected to boost the dollar at the beginning of President Trump’s second term. However, given the onset of trade disputes, along with a repricing of tech stocks, the dollar has weakened significantly. Since the announcement of a reduction in tariffs between the U.S. and China, the S&P 500 Index has retraced nearly all the sell-off since Liberation Day, but the dollar remains relatively weak.
What we are likely seeing is the unwinding of an EM-style carry trade, whereby leveraged investors holding U.S. assets without hedging foreign exchange (FX) are compelled by political events to quickly reassess their return prospects and shift to more diversified portfolios. Starting from a position of high exposure to dollar assets and elevated valuations, this phenomenon could continue.
Has the tide officially turned for the dollar?
Although several foundational elements of the dollar’s reserve currency status have been compromised, they remain fundamentally sound, both in absolute terms and compared to other viable currencies. While we may see the dollar weaken further from current levels, we are unlikely to be at a major turning point in the dollar’s bull cycle.
The dollar remains the leading currency for facilitating global trade and capital flows, with over 50% of global trade and cross-border claims invoiced in dollars, even though the U.S. makes up just over 13% of global imports.
Meanwhile, it’s the predominant currency held in international reserves, although the share has been declining. In 2024, the dollar made up 58% of global FX reserves, a decrease from 65% a decade earlier. And during economic shocks or periods of risk aversion, investors still prefer the dollar as a store of value, even if a crisis originates in the U.S., such as the 2008 global financial crisis.
Reserve managers require access to liquid, reliable and deep capital markets. While many countries may wish to relax their dollar dependence, its dominance as the global reserve currency will persist unless deeper and more liquid capital markets develop.
So, while the dollar has been overvalued for almost a decade on fundamental valuation models, it’s too soon to conclude we are now in a period of sustained dollar weakness. For that, we would need to see a sharp drop in U.S. growth, a recession or a significant increase in growth in the rest of the world.
Learn more about
EM-style carry trade in currencies refers to a strategy where investors borrow in a low-yielding currency (often from a developed market) and invest in a higher yielding currency from an emerging market (EM) to profit from the interest rate differential.
Purchasing power parity (PPP) is an economic theory that compares the relative value of currencies by comparing the cost of a standard basket of goods and services in different countries.
J.P. Morgan Real Broad Effective Exchange Rate (REER) Index: Measures the dollar’s value relative to a broad basket of currencies, adjusted for inflation differentials.
The Bloomberg Dollar Spot Index (BBDXY) tracks the performance of a basket of leading global currencies versus the U.S. Dollar. The index represents both developed and emerging markets currencies that have the highest liquidity in currency markets and the biggest trade flows with the U.S. The annually updated composition and diversified representation of currencies aims to provide a global measure of the U.S. Dollar.
S&P 500 Index: A market-capitalization-weighted index based on the results of approximately 500 widely held common stocks.
Liberation Day: The current Trump administration referred to April 2 as “Liberation Day,” whereby announcing a wide range of tariff policy on various nations.
Our latest insights
-
-
Market Volatility
-
-
Currencies
-
Market Volatility
RELATED INSIGHTS
-
Market Volatility
-
-
Emerging Markets
Commissions, trailing commissions, management fees and expenses all may be associated with investments in investment funds. Please read the prospectus before investing. Investment funds are not guaranteed or covered by the Canada Deposit Insurance Corporation or by any other government deposit insurer. For investment funds other than money market funds, their values change frequently. For money market funds, there can be no assurances that the fund will be able to maintain its net asset value per security at a constant amount or that the full amount of your investment in the fund will be returned to you. Past performance may not be repeated.
Unless otherwise indicated, the investment professionals featured do not manage Capital Group‘s Canadian investment funds.
References to particular companies or securities, if any, are included for informational or illustrative purposes only and should not be considered as an endorsement by Capital Group. Views expressed regarding a particular company, security, industry or market sector should not be considered an indication of trading intent of any investment funds or current holdings of any investment funds. These views should not be considered as investment advice nor should they be considered a recommendation to buy or sell.
Statements attributed to an individual represent the opinions of that individual as of the date published and do not necessarily reflect the opinions of Capital Group or its affiliates. This information is intended to highlight issues and not be comprehensive or to provide advice. For informational purposes only; not intended to provide tax, legal or financial advice. Capital Group funds are available in Canada through registered dealers. For more information, please consult your financial and tax advisors for your individual situation.
Forward-looking statements are not guarantees of future performance, and actual events and results could differ materially from those expressed or implied in any forward-looking statements made herein. We encourage you to consider these and other factors carefully before making any investment decisions and we urge you to avoid placing undue reliance on forward-looking statements.
The S&P 500 Composite Index (“Index”) is a product of S&P Dow Jones Indices LLC and/or its affiliates and has been licensed for use by Capital Group. Copyright © 2026 S&P Dow Jones Indices LLC, a division of S&P Global, and/or its affiliates. All rights reserved. Redistribution or reproduction in whole or in part are prohibited without written permission of S&P Dow Jones Indices LLC.
FTSE source: London Stock Exchange Group plc and its group undertakings (collectively, the "LSE Group"). © LSE Group 2026. FTSE Russell is a trading name of certain of the LSE Group companies. "FTSE®" is a trade mark of the relevant LSE Group companies and is used by any other LSE Group company under licence. All rights in the FTSE Russell indices or data vest in the relevant LSE Group company which owns the index or the data. Neither LSE Group nor its licensors accept any liability for any errors or omissions in the indices or data and no party may rely on any indices or data contained in this communication. No further distribution of data from the LSE Group is permitted without the relevant LSE Group company's express written consent. The LSE Group does not promote, sponsor or endorse the content of this communication. The index is unmanaged and cannot be invested in directly.
BLOOMBERG® is a trademark and service mark of Bloomberg Finance L.P. and its affiliates (collectively “Bloomberg”). Bloomberg or Bloomberg’s licensors own all proprietary rights in the Bloomberg Indices. Neither Bloomberg nor Bloomberg’s licensors approves or endorses this material, or guarantees the accuracy or completeness of any information herein, or makes any warranty, express or implied, as to the results to be obtained therefrom and, to the maximum extent allowed by law, neither shall have any liability or responsibility for injury or damages arising in connection therewith.
The MSCI information may only be used for your internal use, may not be reproduced or redisseminated in any form and may not be used as a basis for or a component of any financial instruments or products or indices. None of the MSCI information is intended to constitute investment advice or a recommendation to make (or refrain from making) any kind of investment decision and may not be relied on as such. Historical data and analysis should not be taken as an indication or guarantee of any future performance analysis, forecast or prediction. The MSCI information is provided on an “as is” basis and the user of this information assumes the entire risk of any use made of this information. MSCI, each of its affiliates and each other person involved in or related to compiling, computing or creating any MSCI information (collectively, the “MSCI Parties”) expressly disclaims all warranties (including, without limitation, any warranties of originality, accuracy, completeness, timeliness, non-infringement, merchantability and fitness for a particular purpose) with respect to this information. Without limiting any of the foregoing, in no event shall any MSCI Party have any liability for any direct, indirect, special, incidental, punitive, consequential (including, without limitation, lost profits) or any other damages. (www.msci.com)
Capital believes the software and information from FactSet to be reliable. However, Capital cannot be responsible for inaccuracies, incomplete information or updating of the information furnished by FactSet. The information provided in this report is meant to give you an approximate account of the fund/manager's characteristics for the specified date. This information is not indicative of future Capital investment decisions and is not used as part of our investment decision-making process.
Indices are unmanaged and cannot be invested in directly. Returns represent past performance, are not a guarantee of future performance, and are not indicative of any specific investment.
All Capital Group trademarks are owned by The Capital Group Companies, Inc. or an affiliated company in Canada, the U.S. and other countries. All other company names mentioned are the property of their respective companies.
Capital Group funds are offered in Canada by Capital International Asset Management (Canada), Inc., part of Capital Group, a global investment management firm originating in Los Angeles, California in 1931. Capital Group manages equity assets through three investment groups. These groups make investment and proxy voting decisions independently. Fixed income investment professionals provide fixed income research and investment management across the Capital organization; however, for securities with equity characteristics, they act solely on behalf of one of the three equity investment groups.
The Capital Group funds offered on this website are available only to Canadian residents.