Market Volatility
Categories
Markets & Economy
Midyear Outlook in 5 charts
 Chris Buchbinder
 Martin Jacobs
 Samir Parekh
 Chit Purani
July 31, 2025
Who would have thought that after multiple wars, unpredictable trade policies and fraying geopolitical alliances, markets would have bounced back at the midpoint of 2025? Yet after a few volatile months, the S&P 500 Index hit multiple record highs and is up 8.18% through July 30, 2025 — a testament to market resilience.
Still, rising tariffs, complex trade negotiations and ongoing conflicts in Ukraine and the Middle East suggest that uncertainty will continue to influence markets in the months ahead. To help put these events in context for investors, here are five charts that illustrate Capital Group’s 2025 Midyear Outlook.
1. Four scenarios for global realignment
Rising uncertainty has complicated the task of creating economic forecasts. A global trade war and shifting political alliances could slow growth, boost inflation and raise the risk of a recession. Alternatively, markets may continue to respond positively to constructive trade negotiations.
Global realignment: A world in transition
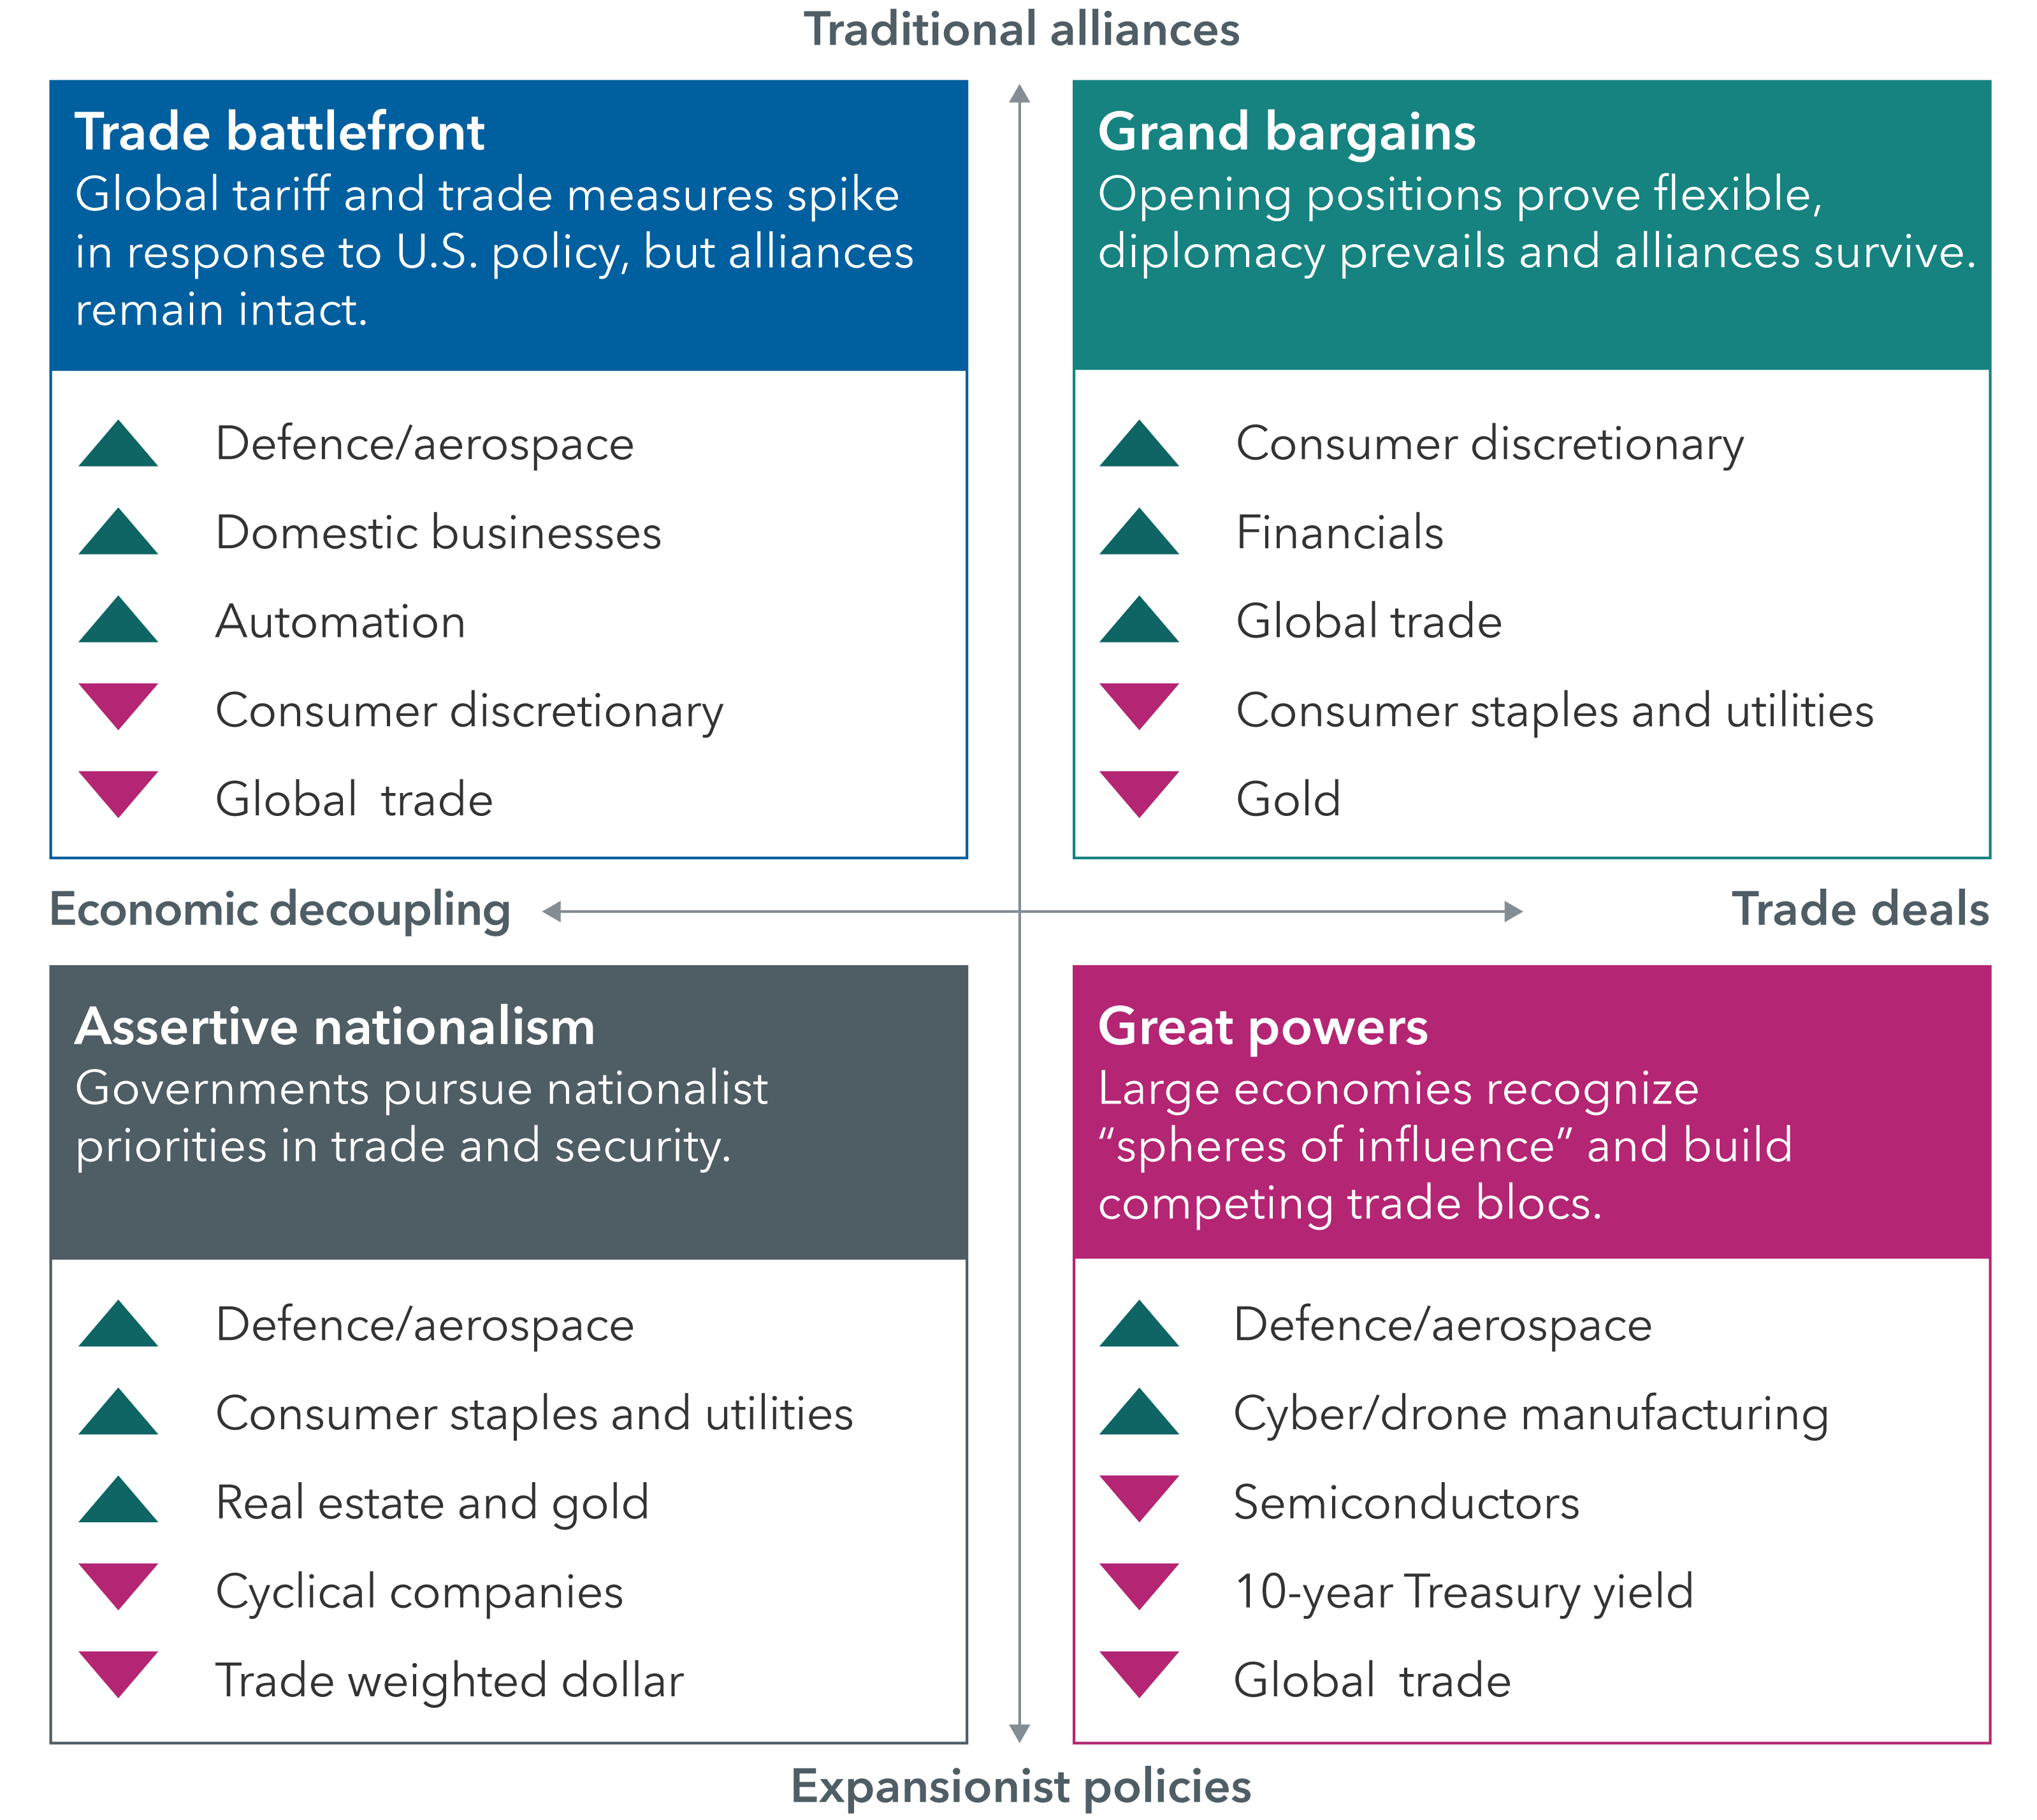
Source: Capital Group. Scenarios reflect analysis of Capital Group’s Night Watch team as of April 2025, and are not predictive of future outcomes.
That’s why Capital Group’s Night Watch team of economists and portfolio managers uses scenario planning, rather than predictions, to prepare for whatever the future brings. They identify a range of outcomes, then connect them to investment implications.
Four potential outcomes have emerged: a trade battlefront, characterized by significant tariffs and other protectionist measures; grand bargains, the most benign scenario; the return of great powers; and assertive nationalism.
Each scenario has different implications for specific industries and stock and bond markets. But one commonality across all four is greater defence spending due to rising geopolitical conflict — an unfortunate reality in today’s world.
2. Security emerges as an investment theme
A fragmented and increasingly hostile geopolitical landscape has forced nations to invest aggressively to safeguard vital resources. In this environment, security has become a key investment theme.
For starters, governments are escalating defense spending. “There has been a recognition in Europe, Japan and elsewhere that they must be more self-sufficient in terms of their defence,” says Samir Parekh, a portfolio manager for Capital Group International Equity Fund™ (Canada).
Security also extends beyond national defence. Worldwide, countries are prioritizing resilience in energy, supply chains and technology. Several industries and companies could benefit. Global giants like Mitsubishi Heavy Industries in Japan, Siemens Energy in Germany and GE Vernova in the U.S. offer products across these categories, including power generation, grid modernization, defence systems and cybersecurity.
Push for security may open opportunity

Sources: Capital Group, FactSet. Companies shown are among the largest constituents of their respective sub-industries within the MSCI All Country World Index. As of June 30, 2025.
3. Market selloffs present opportunities
Markets often overreact to near-term volatility, punishing strong companies along with the weak — a dynamic that played out in early April. This can present long-term opportunities for patient investors.
A look back at the pandemic-induced bear market in 2020 is a case in point. Stocks across a range of industries suffered double-digit losses. “With travel and leisure activities halted, cruise lines like Royal Caribbean were priced as if no one would ever book passage again,” recalls Chris Buchbinder, portfolio manager for Capital Group U.S. Equity Fund™ (Canada). “This turned out to be an excellent investment opportunity for those who recognized that global travel would one day bounce back.”
After plummeting more than 83% in the depths of COVID-19, Royal Caribbean rebounded strongly, advancing more than 1,000% in the five years since.
Of course, such powerful turnarounds don’t come along every day. “When markets were whipsawed by tariff news in the first half of the year, we saw an opportunity to invest in certain health care companies offering GLP-1 weight loss therapies,” Buchbinder adds.
Semiconductor companies are another area of opportunity, given the long runway of potential growth for AI infrastructure. “The key when great companies go on sale is you have to be prepared to weather some anxiety near term,” Buchbinder continues. “Not all companies will have such powerful recoveries, which is why fundamental research helps me select those that I believe may prosper.
4. Bonds offer relative stability
Investors count on bonds to zig when stock markets zag. That’s exactly what happened during the policy-induced stock market volatility that roiled markets earlier this year.
Specifically, when the S&P 500 Index fell 18.7% from the record high set on February 19, 2025, to the recent low on April 8, 2025, the Bloomberg U.S. Aggregate Bond Index gained 1% (in U.S. dollar terms). This relationship will be vital should economic conditions weaken abruptly. The U.S. Fed can lower interest rates beyond expectations and provide a tailwind for bond returns since bond prices increase as yields decline.
Maintaining a balanced core bond portfolio is important to Chitrang Purani, fixed income portfolio manager.
“I currently favour high-quality issuers across bond sectors, as you’re not getting paid appropriately to take on riskier investments. The market has priced in a very optimistic outlook, and while recession is not my base case, it’s crucial for bond portfolios to serve as a ballast when volatility hits.”
5. Markets have been resilient over time
The desire to act when markets tumble is understandable. But the cost of selling could be significant.
In 2018, during U.S. President Donald Trump’s first term, a series of new tariffs launched against China sparked a trade war that roiled markets and dominated headlines, much like today. How did stocks react? The S&P 500 Index in U.S. dollar terms dropped 4.4% in 2018 on fears of an economic slowdown and higher inflation. But the index recovered sharply in 2019, rising 31.5%, as trade deals were announced and consumer spending remained steady.
Markets recovered from trade uncertainty in Trump’s first term

Sources: Capital Group, U.S. Bureau of Labor Statistics, Peterson Institute for International Economics, Standard & Poor’s. Value of investment in the S&P 500 reflects the total return of the index over the period from January 1, 2018, to December 31, 2019. Past results are not predictive of results in future periods. Returns are in USD.
“Trump’s first term shows the outcome can vary significantly from the initial headlines,” says Martin Jacobs, a portfolio manager for Capital Group U.S. Equity Fund™ (Canada). “As someone who believes the market tends to go up far more than it goes down, I am not discouraged by this year’s volatility. I view the dislocation as an opportunity to invest in great companies and multiyear investment trends where I have conviction, setting up the portfolios I manage for years to come.”
The world has changed since that initial round of tariffs. The rapid development of artificial intelligence and the greatest inflation shock in decades have had significant economic implications. The first half of 2025 shows just how unpredictable markets are. We don’t know what next year will bring, but history shows that markets have proven to be resilient over time.
Learn more about
Bloomberg U.S. Aggregate Bond Index represents the U.S. investment-grade fixed-rate bond market.
MSCI All Country World Index is a free float-adjusted, market capitalization-weighted index that is designed to measure equity market results in the global developed and emerging markets, consisting of more than 40 developed and emerging market country indexes.
S&P 500 Index is a market capitalization-weighted index based on the results of approximately 500 widely held common stocks.
Our latest insights
-
-
Markets & Economy
-
Asset Allocation
-
-
Artificial Intelligence
RELATED INSIGHTS
-
Market Volatility
-
Markets & Economy
-
Asset Allocation
Commissions, trailing commissions, management fees and expenses all may be associated with investments in investment funds. Please read the prospectus before investing. Investment funds are not guaranteed or covered by the Canada Deposit Insurance Corporation or by any other government deposit insurer. For investment funds other than money market funds, their values change frequently. For money market funds, there can be no assurances that the fund will be able to maintain its net asset value per security at a constant amount or that the full amount of your investment in the fund will be returned to you. Past performance may not be repeated.
Unless otherwise indicated, the investment professionals featured do not manage Capital Group‘s Canadian investment funds.
References to particular companies or securities, if any, are included for informational or illustrative purposes only and should not be considered as an endorsement by Capital Group. Views expressed regarding a particular company, security, industry or market sector should not be considered an indication of trading intent of any investment funds or current holdings of any investment funds. These views should not be considered as investment advice nor should they be considered a recommendation to buy or sell.
Statements attributed to an individual represent the opinions of that individual as of the date published and do not necessarily reflect the opinions of Capital Group or its affiliates. This information is intended to highlight issues and not be comprehensive or to provide advice. For informational purposes only; not intended to provide tax, legal or financial advice. Capital Group funds are available in Canada through registered dealers. For more information, please consult your financial and tax advisors for your individual situation.
Forward-looking statements are not guarantees of future performance, and actual events and results could differ materially from those expressed or implied in any forward-looking statements made herein. We encourage you to consider these and other factors carefully before making any investment decisions and we urge you to avoid placing undue reliance on forward-looking statements.
The S&P 500 Composite Index (“Index”) is a product of S&P Dow Jones Indices LLC and/or its affiliates and has been licensed for use by Capital Group. Copyright © 2026 S&P Dow Jones Indices LLC, a division of S&P Global, and/or its affiliates. All rights reserved. Redistribution or reproduction in whole or in part are prohibited without written permission of S&P Dow Jones Indices LLC.
FTSE source: London Stock Exchange Group plc and its group undertakings (collectively, the "LSE Group"). © LSE Group 2026. FTSE Russell is a trading name of certain of the LSE Group companies. "FTSE®" is a trade mark of the relevant LSE Group companies and is used by any other LSE Group company under licence. All rights in the FTSE Russell indices or data vest in the relevant LSE Group company which owns the index or the data. Neither LSE Group nor its licensors accept any liability for any errors or omissions in the indices or data and no party may rely on any indices or data contained in this communication. No further distribution of data from the LSE Group is permitted without the relevant LSE Group company's express written consent. The LSE Group does not promote, sponsor or endorse the content of this communication. The index is unmanaged and cannot be invested in directly.
BLOOMBERG® is a trademark and service mark of Bloomberg Finance L.P. and its affiliates (collectively “Bloomberg”). Bloomberg or Bloomberg’s licensors own all proprietary rights in the Bloomberg Indices. Neither Bloomberg nor Bloomberg’s licensors approves or endorses this material, or guarantees the accuracy or completeness of any information herein, or makes any warranty, express or implied, as to the results to be obtained therefrom and, to the maximum extent allowed by law, neither shall have any liability or responsibility for injury or damages arising in connection therewith.
The MSCI information may only be used for your internal use, may not be reproduced or redisseminated in any form and may not be used as a basis for or a component of any financial instruments or products or indices. None of the MSCI information is intended to constitute investment advice or a recommendation to make (or refrain from making) any kind of investment decision and may not be relied on as such. Historical data and analysis should not be taken as an indication or guarantee of any future performance analysis, forecast or prediction. The MSCI information is provided on an “as is” basis and the user of this information assumes the entire risk of any use made of this information. MSCI, each of its affiliates and each other person involved in or related to compiling, computing or creating any MSCI information (collectively, the “MSCI Parties”) expressly disclaims all warranties (including, without limitation, any warranties of originality, accuracy, completeness, timeliness, non-infringement, merchantability and fitness for a particular purpose) with respect to this information. Without limiting any of the foregoing, in no event shall any MSCI Party have any liability for any direct, indirect, special, incidental, punitive, consequential (including, without limitation, lost profits) or any other damages. (www.msci.com)
Capital believes the software and information from FactSet to be reliable. However, Capital cannot be responsible for inaccuracies, incomplete information or updating of the information furnished by FactSet. The information provided in this report is meant to give you an approximate account of the fund/manager's characteristics for the specified date. This information is not indicative of future Capital investment decisions and is not used as part of our investment decision-making process.
Indices are unmanaged and cannot be invested in directly. Returns represent past performance, are not a guarantee of future performance, and are not indicative of any specific investment.
All Capital Group trademarks are owned by The Capital Group Companies, Inc. or an affiliated company in Canada, the U.S. and other countries. All other company names mentioned are the property of their respective companies.
Capital Group funds are offered in Canada by Capital International Asset Management (Canada), Inc., part of Capital Group, a global investment management firm originating in Los Angeles, California in 1931. Capital Group manages equity assets through three investment groups. These groups make investment and proxy voting decisions independently. Fixed income investment professionals provide fixed income research and investment management across the Capital organization; however, for securities with equity characteristics, they act solely on behalf of one of the three equity investment groups.
The Capital Group funds offered on this website are available only to Canadian residents.