Market Volatility
Categories
Bonds
Bond outlook: Income potential intact as economic risks rise
 Chit Purani
 Timothy Ng
 Xavier Goss
 Tom Chow
June 19, 2025
The bond market is well positioned to provide investors with attractive income potential and relative stability, should equity markets swing lower in the second half of the year. Given slowing U.S. economic growth and cooling inflation, bonds should offer a smoother ride for investors amid high uncertainty over U.S. trade and immigration policies, rising debt levels and worsening conflicts in Ukraine and the Middle East.
“Economic conditions are steady but softening, with labour markets and consumer spending gradually slowing,” says fixed income portfolio manager Chitrang Purani. “Ongoing uncertainty around tariff levels — as well as the time it takes to reach these agreements — will continue to weigh on business and consumer sentiment. It could also negatively impact economic data during the second half of this year.”
Investors are cutting rate cut expectations
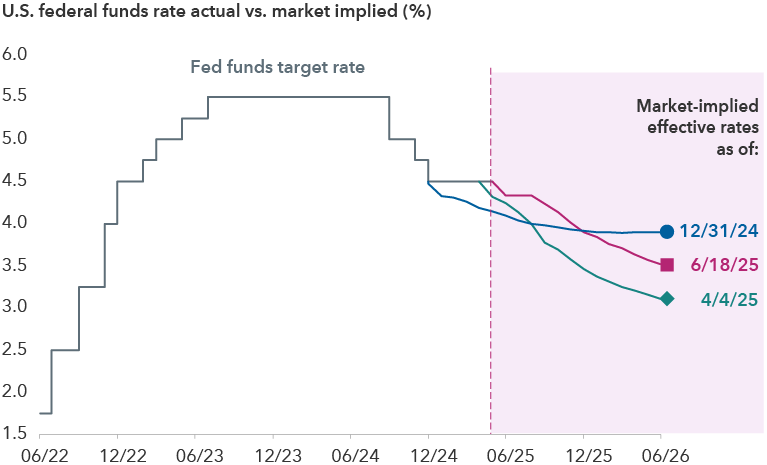
Sources: Capital Group, Bloomberg Index Services Ltd., U.S. Federal Reserve. Fed funds target rate reflects the upper bound of the Federal Open Markets Committee’s (FOMC) target range for overnight lending among U.S. banks. As of June 18, 2025.
Building a core bond portfolio that balances seeking return against minimizing exposure to elevated market volatility is important to Purani. “I currently favour an up-in-quality tilt toward credit exposures across bond sectors and issuers, as you’re not getting paid appropriately to take on riskier investments. The market has priced in a very optimistic outlook, and while recession is not my base case, it’s crucial for bond portfolios to serve as a ballast when volatility hits.”
Meanwhile, inflation risks continue to plague markets — and the U.S. Federal Reserve. At the June 2025 meeting, the Fed extended the pause on rate cuts and left the target range unchanged at 4.25% to 4.50%. The latest projections show rates to end the year at 3.9%, which suggests modest rate cuts for the remainder of the year.
Waking a sleeping giant
Moves in the rapidly growing US$28 trillion U.S. Treasury market have emerged as a flashpoint for policymakers and investors.
Yields on the 10-year Treasury, arguably the most important interest rate in the world, reached 4.39% as of June 18, 2025, compared to 4% in early April. The upward march came even as yields on shorter dated Treasuries declined, steepening the yield curve.
As equities entered a correction, bonds provided a buffer

Source: Bloomberg. As of April 8, 2025. A correction is defined as a price decline of 10% or more (without dividends reinvested) in the S&P 500 Index with at least 75% recovery. Returns are in USD.
“Investors are balancing concerns of higher inflation and a potential downturn, both stemming from a tariff policy that continues to evolve,” says Tim Ng, a portfolio manager for Capital Group Canadian Core Plus Fixed Income Fund™ (Canada). Expectations of a growing U.S. federal budget deficit amid potential tax cuts and other spending plans also play a role in keeping long-term yields high.
“There’s room for the curve to further steepen in several scenarios,” explains Ng, who is maintaining flexibility considering recent market swings. “While the worst of trade policy uncertainty may be behind us, I want to be positioned to take advantage of any major shifts in valuations.”
Investors count on bonds to zig when stock markets zag. That’s exactly what happened during the policy-induced stock market volatility. Specifically, when the S&P 500 Index fell 18.7% from the record high set on February 19, 2025, to the recent low on April 8, 2025, the Bloomberg U.S. Aggregate Bond Index gained 1%. The return of this time-honoured relationship, which disappeared in 2022 during the Fed’s rate-hiking spree, is crucial as Trump’s policy initiatives raise the risk of a recession. Specifically, should economic conditions weaken abruptly, the Fed can lower interest rates beyond expectations and provide a tailwind for bond returns since bond prices increase as yields decline.
Securitized credit offers competitive income potential
In a world where ongoing periods of volatility are likely, exposure to securitized assets including agency mortgage-backed securities (MBS) could benefit portfolios given their higher quality and attractive nominal yields and spreads compared to corporate credit. The appeal of agency MBS is further bolstered by the sector’s liquidity and relative resilience in past downturns.
Compelling valuations in high-coupon U.S. MBS

Sources: Capital Group, Bloomberg Index Services Ltd. Figures based on the coupon stack for the Bloomberg U.S. Mortgage Backed Securities (MBS) Index. Nominal spread represents the zero-volatility spread. As of May 31, 2025.
Active coupon selection is an important factor in mortgage portfolios. Higher coupons offer compelling income opportunities with low sensitivity to rates even if interest rates and volatility remain elevated. In contrast, low coupons, which are more prevalent in the Bloomberg U.S. Mortgage Backed Securities Index, have higher interest rate sensitivity and lower nominal spreads and yields.
Many areas of securitized credit look appealing, such as the senior tranches of subprime auto asset-backed securities. “The underlying loans have shorter maturities compared to mortgages, and lending standards have tightened over the past decade,” says Xavier Goss, a portfolio manager for Capital Group Multi-Sector Fixed Income Fund™ (Canada).
Some commercial mortgage-backed securities, particularly higher segments of the capital structure, also offer strong income with reasonable valuations. While some office properties still face challenges in the post-COVID era, multifamily housing, warehouses and other segments of the market have solid balance sheets, steady cash flows and strong demand.
Corporate bonds show continued resilience
Healthy corporate fundamentals and attractive yields should help corporate investment-grade (BBB/Baa and above) and high-yield bonds weather potential headwinds to growth.
“Corporate earnings are reasonable, though rising costs and weaker consumer sentiment muddy the general economic outlook,” says portfolio manager Tom Chow. “In periods of declining growth expectations, established entities with strong credit metrics, low refinancing risk and sizable equity cushions are better positioned to weather the storm,” Chow explains.
High-yield bonds posted strong returns at current yields

Sources: Bloomberg Index Services Ltd. As of May 31, 2025. Average forward two-year and three-year returns are annualized. Returns are in USD.
Companies with non-cyclical businesses are still capable of improving their financial profile and reducing refinancing risk. For example, within investment-grade rated companies, certain pharmaceuticals, such as Amgen, are reducing debt following recent acquisitions. In high yield, telecom company Charter Communications has recurring revenue streams, while security and defence companies including Axon Enterprises may be less affected by the economic cycle.
Today’s starting yields for higher income sectors such as investment-grade, high-yield and emerging markets debt offer attractive entry points for long-term investors. Even if spreads to U.S. Treasuries widen to impact price, the income component should help support positive returns. Moreover, rate cuts expected from the Fed later this year could be tailwinds for bond returns, particularly those with longer maturities.
Corporate defaults are expected to remain low relative to the historical average of roughly 3%. “Many high-yield companies refinanced debt ahead of tariff-induced volatility, so a ‘maturity wall’ is not a major, imminent concern,” Chow adds.
Bonds are in better shape for a changing world
The U.S. economy has proven to be resilient through high inflation and elevated yields, which remain near multi-decade highs, but ongoing trade negotiations and other policy initiatives complicate the economic outlook. Though most economists and investors don’t expect a recession, they agree the chance of one has increased.
“Growth remains solid due to healthy labour markets and corporate profits in the U.S., but near-term risks to growth appear tilted modestly to the downside,” Purani says. “Over the long run, shifts in global economic and political alliances are likely to force changes to traditional economic growth drivers across regions, which may increase dispersion among winners and losers. This is an environment which supports the role of bonds as a portfolio ballast and highlights the potential value of active management.”
Learn more about
Nominal spread: The difference between the yield of a bond and yield of a similar maturity Treasury bond.
Coupon: Annual interest rate paid on a bond, based on the bond’s face value.
Yield to worst is the lowest yield that can be realized by either calling or putting on one of the available call/put dates or holding a bond to maturity.
The after-tax (or tax-equivalent) yield of a municipal bond investment is the yield a taxable bond would have to offer to equal the same amount as the tax-exempt bond.
The market indices are unmanaged and, therefore, have no expenses. Investors cannot invest directly in an index.
Bloomberg U.S. Aggregate Bond Index represents the U.S. investment-grade fixed-rate bond market.
Bloomberg U.S. Corporate High Yield 2% Issuer Capped Index covers the universe of fixed-rate, non-investment-grade debt. The index limits the maximum exposure of any one issuer to 2%.
Bloomberg U.S. Corporate Investment Grade Index represents the universe of investment grade, publicly issued U.S. corporate and specified foreign debentures and secured notes that meet the specified maturity, liquidity and quality requirements.
Bloomberg U.S. Mortgage Backed Securities Index is a market value-weighted index that covers the mortgage-backed pass-through securities of Ginnie Mae (GNMA), Fannie Mae (FNMA) and Freddie Mac (FHLMC).
S&P 500 Index is a market capitalization-weighted index based on the results of approximately 500 widely held common stocks.
Our latest insights
-
-
Markets & Economy
-
Asset Allocation
-
-
Artificial Intelligence
RELATED INSIGHTS
-
Market Volatility
-
-
Market Volatility
Commissions, trailing commissions, management fees and expenses all may be associated with investments in investment funds. Please read the prospectus before investing. Investment funds are not guaranteed or covered by the Canada Deposit Insurance Corporation or by any other government deposit insurer. For investment funds other than money market funds, their values change frequently. For money market funds, there can be no assurances that the fund will be able to maintain its net asset value per security at a constant amount or that the full amount of your investment in the fund will be returned to you. Past performance may not be repeated.
Unless otherwise indicated, the investment professionals featured do not manage Capital Group‘s Canadian investment funds.
References to particular companies or securities, if any, are included for informational or illustrative purposes only and should not be considered as an endorsement by Capital Group. Views expressed regarding a particular company, security, industry or market sector should not be considered an indication of trading intent of any investment funds or current holdings of any investment funds. These views should not be considered as investment advice nor should they be considered a recommendation to buy or sell.
Statements attributed to an individual represent the opinions of that individual as of the date published and do not necessarily reflect the opinions of Capital Group or its affiliates. This information is intended to highlight issues and not be comprehensive or to provide advice. For informational purposes only; not intended to provide tax, legal or financial advice. Capital Group funds are available in Canada through registered dealers. For more information, please consult your financial and tax advisors for your individual situation.
Forward-looking statements are not guarantees of future performance, and actual events and results could differ materially from those expressed or implied in any forward-looking statements made herein. We encourage you to consider these and other factors carefully before making any investment decisions and we urge you to avoid placing undue reliance on forward-looking statements.
The S&P 500 Composite Index (“Index”) is a product of S&P Dow Jones Indices LLC and/or its affiliates and has been licensed for use by Capital Group. Copyright © 2026 S&P Dow Jones Indices LLC, a division of S&P Global, and/or its affiliates. All rights reserved. Redistribution or reproduction in whole or in part are prohibited without written permission of S&P Dow Jones Indices LLC.
FTSE source: London Stock Exchange Group plc and its group undertakings (collectively, the "LSE Group"). © LSE Group 2026. FTSE Russell is a trading name of certain of the LSE Group companies. "FTSE®" is a trade mark of the relevant LSE Group companies and is used by any other LSE Group company under licence. All rights in the FTSE Russell indices or data vest in the relevant LSE Group company which owns the index or the data. Neither LSE Group nor its licensors accept any liability for any errors or omissions in the indices or data and no party may rely on any indices or data contained in this communication. No further distribution of data from the LSE Group is permitted without the relevant LSE Group company's express written consent. The LSE Group does not promote, sponsor or endorse the content of this communication. The index is unmanaged and cannot be invested in directly.
BLOOMBERG® is a trademark and service mark of Bloomberg Finance L.P. and its affiliates (collectively “Bloomberg”). Bloomberg or Bloomberg’s licensors own all proprietary rights in the Bloomberg Indices. Neither Bloomberg nor Bloomberg’s licensors approves or endorses this material, or guarantees the accuracy or completeness of any information herein, or makes any warranty, express or implied, as to the results to be obtained therefrom and, to the maximum extent allowed by law, neither shall have any liability or responsibility for injury or damages arising in connection therewith.
The MSCI information may only be used for your internal use, may not be reproduced or redisseminated in any form and may not be used as a basis for or a component of any financial instruments or products or indices. None of the MSCI information is intended to constitute investment advice or a recommendation to make (or refrain from making) any kind of investment decision and may not be relied on as such. Historical data and analysis should not be taken as an indication or guarantee of any future performance analysis, forecast or prediction. The MSCI information is provided on an “as is” basis and the user of this information assumes the entire risk of any use made of this information. MSCI, each of its affiliates and each other person involved in or related to compiling, computing or creating any MSCI information (collectively, the “MSCI Parties”) expressly disclaims all warranties (including, without limitation, any warranties of originality, accuracy, completeness, timeliness, non-infringement, merchantability and fitness for a particular purpose) with respect to this information. Without limiting any of the foregoing, in no event shall any MSCI Party have any liability for any direct, indirect, special, incidental, punitive, consequential (including, without limitation, lost profits) or any other damages. (www.msci.com)
Capital believes the software and information from FactSet to be reliable. However, Capital cannot be responsible for inaccuracies, incomplete information or updating of the information furnished by FactSet. The information provided in this report is meant to give you an approximate account of the fund/manager's characteristics for the specified date. This information is not indicative of future Capital investment decisions and is not used as part of our investment decision-making process.
Indices are unmanaged and cannot be invested in directly. Returns represent past performance, are not a guarantee of future performance, and are not indicative of any specific investment.
All Capital Group trademarks are owned by The Capital Group Companies, Inc. or an affiliated company in Canada, the U.S. and other countries. All other company names mentioned are the property of their respective companies.
Capital Group funds are offered in Canada by Capital International Asset Management (Canada), Inc., part of Capital Group, a global investment management firm originating in Los Angeles, California in 1931. Capital Group manages equity assets through three investment groups. These groups make investment and proxy voting decisions independently. Fixed income investment professionals provide fixed income research and investment management across the Capital organization; however, for securities with equity characteristics, they act solely on behalf of one of the three equity investment groups.
The Capital Group funds offered on this website are available only to Canadian residents.