Currencies
 Jens Søndergaard
The dollar has lost ground against major currencies so far this year, prompting questions as to whether the dollar’s multi-year bull run is coming to an end. About a month after "Liberation Day," the U.S. dollar has shown signs of stabilization, though it continues to soften against most developed and emerging markets currencies. Here’s my latest thinking on what factors could cause sustained weakness in the dollar.
Prolonged dollar weakness requires a growth slowdown
Year-to-date, the dollar has declined 8% against the euro and yen and 6% against the pound. It’s also fallen against many emerging markets currencies, notably the Mexican peso and Brazilian real.
For the dollar to enter a prolonged period of decline, we would need to see either U.S. growth sharply weaken or growth in the rest of the world pick up strongly.
U.S. growth could decline through policy uncertainty. While tariffs do not normally cause currency weakness for the country imposing them, unpredictable tariffs that leave businesses hesitant to make long-term investment decisions might. We can already see evidence of a slowdown in U.S. growth momentum, although the risks of a recession have now likely diminished, in light of negotiations with China.
Another way to achieve sustained weakness in the dollar is by an increase in growth trends in other parts of the world. As illustrated in the chart, the gap between U.S. and European growth appears to be narrowing for 2025, but we would need the relative growth trend to change to really see a reversal of the dollar bull cycle.
Global growth differentials are now less bullish on USD

Sources: Capital Strategy Research, Macrobond. Data from March 1, 2023, to May 21, 2025.
European rates have generally been low due to secular stagnation, but the recent announcement of German stimulus combined with the EU’s plan to raise defense spending should pave the way for closer European integration and faster growth in the coming years. That said, it’s not clear whether German defense spending will lead to broad-based European structural growth. And even if it does, it might not happen for a few years.
China’s economy, another engine of growth worldwide, has yet to show a pickup in momentum. China has started to stabilize, although stimulus remains limited. That trend could change as Chinese officials look toward more fiscal measures to offset tariff risks.
What can real rates and growth tell us?
As seen in the chart below, the dollar’s actual performance has been much more closely tied to cyclical factors including growth and real interest rates. The two are connected as interest rate differentials between countries generally reflect a difference in growth and inflation between economies, with stronger growth generally leading to higher interest rates.
10-year Treasury has been correlated to the dollar
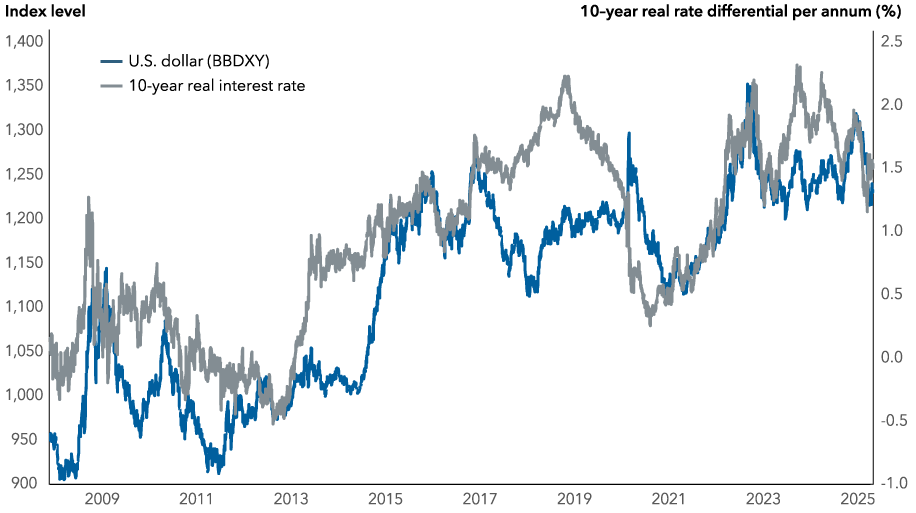
Sources: Capital Strategy Research, Macrobond. BBDXY = The Bloomberg Dollar Spot Index. Data from January 1, 2008, to May 15, 2025. The 10-year real interest rate is the U.S. minus Germany, Japan and U.K. weighted average.
Fundamental valuations suggest the dollar is overvalued
Several longer term models attempt to value the dollar, using trends in productivity, demographics, inflation and any fundamental changes in the economy. These models, including our own, generally all show that the dollar is overvalued.
The purchasing power parity (PPP) theory, for example, suggests exchange rates between currencies are in equilibrium when their purchasing power is the same in each of the two countries. PPP has helped explain broad trends in the dollar’s performance, but it has rarely actually traded in line with expected valuations.
Will the greenback’s overvaluation subside more?

Sources: Capital Strategy Research, J.P. Morgan. The real broad effective exchange rate measures the value of the U.S. dollar against a group of developed and emerging markets currencies and adjusts for inflation using the Consumer Price Index (CPI). CPI is a commonly used measure of inflation that measures the average change over time in the prices paid by consumers for a basket of goods and services. Data from January 1, 1980, to April 1, 2025.
Factors that drove the dollar’s rise
Over the past decade, global demand for U.S. equities, particularly large technology stocks, bolstered the strength of the U.S. dollar. A significant portion of that capital came from Japan and Europe, regions characterized by low interest rates, sluggish economic growth and certain policies that discouraged investors. Solid returns from U.S. assets have also drawn passive investors, such as sovereign wealth funds, and curbed capital outflows from the U.S. to emerging markets (EM). Meanwhile, during periods of heightened risk aversion, investors have sought the security of U.S. Treasuries.
Measures such as tariffs and tax cuts were expected to boost the dollar at the beginning of President Trump’s second term. However, given the onset of trade disputes, along with a repricing of tech stocks, the dollar has weakened significantly. Since the announcement of a reduction in tariffs between the U.S. and China, the S&P 500 Index has retraced nearly all the sell-off since Liberation Day, but the dollar remains relatively weak.
What we are likely seeing is the unwinding of an EM-style carry trade, whereby leveraged investors holding U.S. assets without hedging foreign exchange (FX) are compelled by political events to quickly reassess their return prospects and shift to more diversified portfolios. Starting from a position of high exposure to dollar assets and elevated valuations, this phenomenon could continue.
Has the tide officially turned for the dollar?
Although several foundational elements of the dollar’s reserve currency status have been compromised, they remain fundamentally sound, both in absolute terms and compared to other viable currencies. While we may see the dollar weaken further from current levels, we are unlikely to be at a major turning point in the dollar’s bull cycle.
The dollar remains the leading currency for facilitating global trade and capital flows, with over 50% of global trade and cross-border claims invoiced in dollars, even though the U.S. makes up just over 13% of global imports.
Meanwhile, it’s the predominant currency held in international reserves, although the share has been declining. In 2024, the dollar made up 58% of global FX reserves, a decrease from 65% a decade earlier. And during economic shocks or periods of risk aversion, investors still prefer the dollar as a store of value, even if a crisis originates in the U.S., such as the 2008 global financial crisis.
Reserve managers require access to liquid, reliable and deep capital markets. While many countries may wish to relax their dollar dependence, its dominance as the global reserve currency will persist unless deeper and more liquid capital markets develop.
So, while the dollar has been overvalued for almost a decade on fundamental valuation models, it’s too soon to conclude we are now in a period of sustained dollar weakness. For that, we would need to see a sharp drop in U.S. growth, a recession or a significant increase in growth in the rest of the world.
EM-style carry trade in currencies refers to a strategy where investors borrow in a low-yielding currency (often from a developed market) and invest in a higher yielding currency from an emerging market (EM) to profit from the interest rate differential.
Purchasing power parity (PPP) is an economic theory that compares the relative value of currencies by comparing the cost of a standard basket of goods and services in different countries.
J.P. Morgan Real Broad Effective Exchange Rate (REER) Index: Measures the dollar’s value relative to a broad basket of currencies, adjusted for inflation differentials.
The Bloomberg Dollar Spot Index (BBDXY) tracks the performance of a basket of leading global currencies versus the U.S. Dollar. The index represents both developed and emerging markets currencies that have the highest liquidity in currency markets and the biggest trade flows with the U.S. The annually updated composition and diversified representation of currencies aims to provide a global measure of the U.S. Dollar.
S&P 500 Index: A market-capitalization-weighted index based on the results of approximately 500 widely held common stocks.
Liberation Day: The current Trump administration referred to April 2 as “Liberation Day,” whereby announcing a wide range of tariff policy on various nations.