Private Markets

Allocating to private credit in a portfolio

10 MIN ARTICLE

KEY TAKEAWAYS

  • A modest allocation to semi-liquid credit has the potential to enhance a portfolio’s return profile compared to a traditional public stock and bond portfolio.
  • The potentially enhanced return profile is largely the result of potentially high-yielding credit and illiquidity exposure.
  • Allocation to illiquid credit investments requires special consideration for investor liquidity needs and comfort levels.

For advisers and investors unfamiliar with investing in private credit, questions abound. What are some of the benefits and risks of the asset class? How should investors weigh liquidity concerns? How much of their portfolio should clients consider allocating?  Capital Group colleagues Jan Gundersen, head of wealth solutions, and Victoria Quach, senior client analytics manager, recently discussed these issues.


Jan Gundersen: Victoria, for the advisor or the client who is thinking about adding private credit strategies into a portfolio, there are really two issues involved: first, understanding the benefits and risks within the private credit space and then, how does a private credit strategy fit into a portfolio? How would they position it? Let’s start with potential benefits and risks.

Victoria Quach: That’s a really helpful way to break it down. Broadly speaking, we see private credit as an extension of fixed income, which embraces a more flexible approach to fixed income investment. And remember, at Capital Group we believe fixed income has four key roles in a portfolio: preservation, inflation protection, income and diversification, broadly meaning diversification from equities.

What is private credit’s role in a portfolio?


Private credit doesn’t check all four boxes, but it checks two of them very well. The one that jumps out right away in private credit is income. On average, recent returns show that private credit can provide 3% excess yield relative to high-yield bonds. Our analysis is that private credit has been a stable, consistent source of income generation. The excess yield isn’t free: It’s compensation for the illiquidity risk an investor takes, among other factors. This is considered an illiquid asset class.

Private credit’s role in a portfolio: Income

Source: Bloomberg, Morningstar and Cliffwater. Data is through Sept. 30, 2024 and reflects the most recently available data for all three indexes as of publication. As of Dec. 31, 2024.


U.S. High Yield (1) Represented by Bloomberg U.S. Corporate High Yield 2% Issuer Capped Index Leveraged Loans (2) Represented by Morningstar LSTA US Leveraged Loan 100 Index Private credit (3) Represented by Cliffwater Direct Lending Index


The Cliffwater Direct Lending Index (CDLI) seeks to measure the unlevered, gross of fees performance of U.S. middle market corporate loans, as represented by the underlying assets of Business Development Companies (BDCs), including both exchange-traded and unlisted BDCs, subject to certain eligibility criteria. The CDLI is asset-weighted and calculated quarterly using financial statements and other information contained in the U.S. Securities and Exchange Commission (SEC) filings of all eligible BDCs. The loans captured by the CDLI represent a large share of the direct lending universe and, importantly, represent loans that are originated and held to maximize risk-adjusted return to shareholders and investors.


Index returns shown do not reflect actual trading activities and exclude sales charges or fees associated with purchasing securities or investment funds tracking the index. Additional fees and charges may impact performance of securities or funds compared to the index. Market risks, including financial market fluctuations, liquidity risks and regulatory risks may affect the index’s performance. The index may also be subject to concentration risks if heavily weighted towards specific sectors, industries or geographic regions.

A different kind of diversification

Victoria: The second area of benefit we see is diversification. When we talk about diversification as a role for fixed income, what we mean is diversification from equities, so that if the equities markets weaken, the fixed income in your portfolio has some ability to offset that. But when we talk about diversification as a role for private credit, it’s slightly different  — it’s diversification because you’re gaining exposure to a different set of companies than you would in public corporate credit. You’re getting exposure to middle market companies, often private companies, certainly companies that are less common in public markets. And beyond exposure to a different kind of company, you’re getting exposure to a different structure of loan, which we see as another kind of diversification. For instance, another area of private credit where non-corporate loans are backed by two forms of collateral, (1) pools of credit receivable assets like mortgages and auto loans or (2) specific assets like aircraft, leasing equipment and even music royalties can have cashflow profiles that are distinct from corporate lending. 

Private credit’s role in a portfolio: Diversification

Source: Bloomberg, Morningstar and Cliffwater. Data is through Sept. 30, 2024 and reflects the most recently available data for all three indexes as of publication. As of Dec. 31, 2024.


U.S. High Yield (1) Represented by Bloomberg U.S. Corporate High Yield 2% Issuer Capped Index Leveraged Loans (2) Represented by Morningstar LSTA US Leveraged Loan 100 Index Private credit (3) Represented by Cliffwater Direct Lending Index.


The Cliffwater Direct Lending Index (CDLI) seeks to measure the unlevered, gross of fees performance of U.S. middle market corporate loans, as represented by the underlying assets of Business Development Companies (BDCs), including both exchange-traded and unlisted BDCs, subject to certain eligibility criteria. The CDLI is asset-weighted and calculated quarterly using financial statements and other information contained in the U.S. Securities and Exchange Commission (SEC) filings of all eligible BDCs. The loans captured by the CDLI represent a large share of the direct lending universe and, importantly, represent loans that are originated and held to maximize risk-adjusted return to shareholders and investors.


Index returns shown do not reflect actual trading activities and exclude sales charges or fees associated with purchasing securities or investment funds tracking the index. Additional fees and charges may impact performance of securities or funds compared to the index. Market risks, including financial market fluctuations, liquidity risks and regulatory risks may affect the index’s performance. The index may also be subject to concentration risks if heavily weighted towards specific sectors, industries or geographic regions.

Victoria: If you want to go back to that original fixed income goal of diversification from equities, you can get that too in private credit. If we lean on the traditional measures of diversification in a portfolio, which is correlation, we find that private credit has less correlation to U.S. equities compared to high yield bonds. About 66% historically, whereas high yield bonds have had historically about 86% correlation to U.S. equities. I should note, for a lot of this comparative data we’re using a direct lending index, and that’s what’s available to us from an index-based analysis. So a lot of when we reference the historic performance of private credit, it is the direct lending component.

Why is the yield higher for private credit?


Jan: Can you go a little deeper on incremental yield, where is it coming from? Or to put it another way, why is the yield higher?


Victoria: That’s a great question Jan. And when we think about yield, a meaningful component of the total return for private credit, ultimately what that is, is an investor’s compensation for taking on some kind of risk exposure. For private credit, it’s a mix of largely taking on credit risk and the relatively illiquid nature of the asset class. If we start with the illiquidity premium, it’s not just the fact that these loans aren’t traded easily  — there’s no secondary market for them  — it goes beyond that. The illiquidity premium includes the bespoke, complex structures and the lower level of transparency associated with these types of bonds. And because you’re taking on that risk exposure, you should be compensated for it. In addition, for investors with excess liquidity capacity, investments that offer an illiquidity premium can serve as a way to potentially monetize that surplus.


The illiquidity premium along with unrated credit requires greater expertise to evaluate these types of loans. That investment manager expertise is an important consideration for investors.


Now, let’s dive a little deeper into the credit premium, the compensation investors expect for taking on credit risk. For direct lending specifically, there’s typically no coverage for these types of loans by the credit rating agencies. So who takes on that role here? The role is taken on by the active manager. They are evaluating the credit-worthiness of these borrowers, which can depend on the borrower’s operating cashflows. These types of loans tend to be senior secured loans, at least for direct lending. When we say senior, we mean senior in the capital structure, which means that in the event of a default, these investors are prioritized in the repayment. Whereas typically with public high yield, it’s subordinated, or junior debt, which is lower in the capital structure. And finally, by secured, we mean that they are backed by some sort of collateral, which can include a wide range of assets such as real estate, inventory, etc. Overall, I think the important point here is that the credit premium has different features between public and private credit.

Key question: How much to allocate to private credit?


Victoria: And when an advisor or investor gets to that question of how much of my portfolio should I allocate to private credit, we start where we always start at Capital Group with the questions, “What are the overall objectives of the portfolio? And how do we align asset classes and funds to achieve those objectives?”


Jan: It seems that this is where investors really have to address liquidity issues, and their comfort level with an investment that is not going to be as liquid as public market investments.


Victoria: Absolutely. This issue of how much to allocate to illiquid investments can be a complicated issue, but you can boil it down to three factors. It’s a combination of the investors’ capacity for risk, cash flow needs and time horizon. I think this is somewhat intuitive: The lower the risk capacity and the higher the cash flow needs, the lower an allocation you would make to less liquid investments.


We’ve developed a framework to get us to some answers. It starts with some questions: what is your annual spending rate and what is your time horizon? So let’s assume with a spending rate of four percent and a five-year time horizon. We take those variables and apply them to a hypothetical portfolio consisting of public fixed income, global equities and varying amounts of private equity, private credit and private real estate and then we ran 5,000 simulations over a five-year period.


From those simulations, we found that you can allocate up to 65% in semi-liquid investments and still potentially achieve the 4% spending rate in every period across the five-year period. We believe this is a conservative view, that there’s a high probability you will achieve your spending rate. But this is important, we’re not saying that your optimal allocation to semi-liquid investments is, in this case, 65%. What we are saying is that you can allocate, hypothetically, up to 65% and potentially achieve that annual 4% spend rate. I think this is really powerful, so that investors can understand what that zone of feasibility is and how they should think about allocating to semi-liquid investments. Spoiler alert: We would recommend a considerably lower allocation to private credit, but what we’re establishing here is that you can have a relatively high allocation and still meet annual spending needs.


Jan: And so, this directly addresses concerns about illiquidity being a reason not to invest. If the client needs lump sum access to a lot of money, yes liquidity is a concern. But what you’re showing us here is that the normal level of access of 4% is not impeded by a semi-liquid solution. And to your point we’re not saying, “allocate 65%.” But I think it’s making the point that, for a normal use of your money, the semi-liquid nature should not be a deal-breaker. That’s relevant because I do think the illiquidity of this asset class is what people remember.


So now we’ve positioned the role in the portfolio, we’ve talked about liquidity, are we ready to answer the question, “How would I allocate to this?” Can you talk through some of that allocation guidance?


How might I think about allocating to private credit?

Sample paper portfolios with more aggressive use cases

For illustrative purposes only

Source: Capital Group

For illustrative purposes only

Source: Capital Group

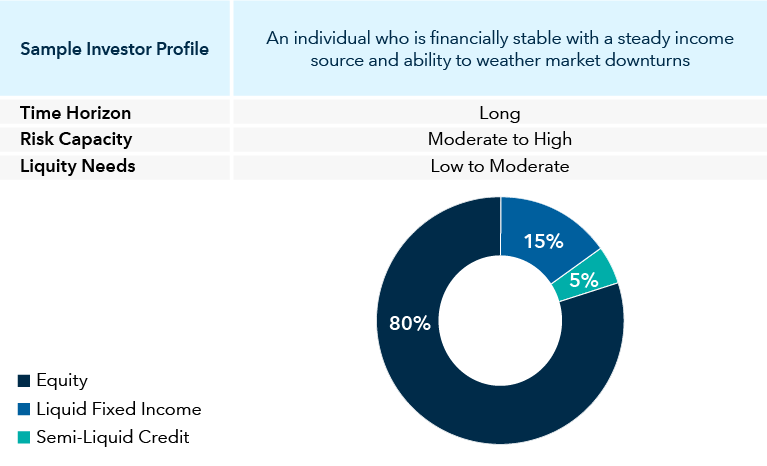
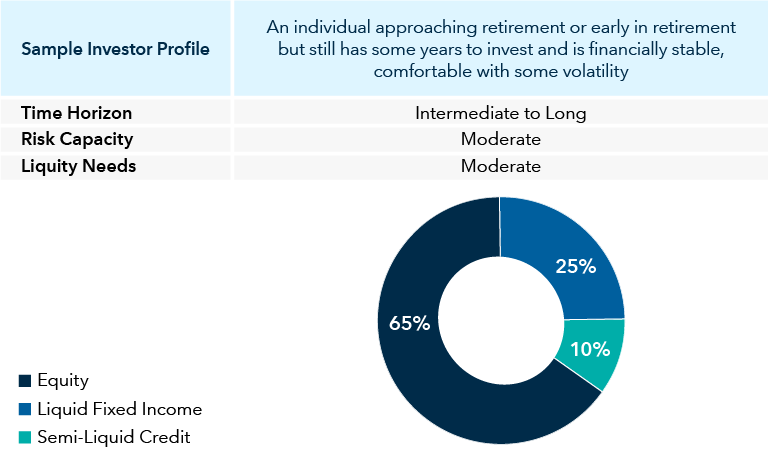
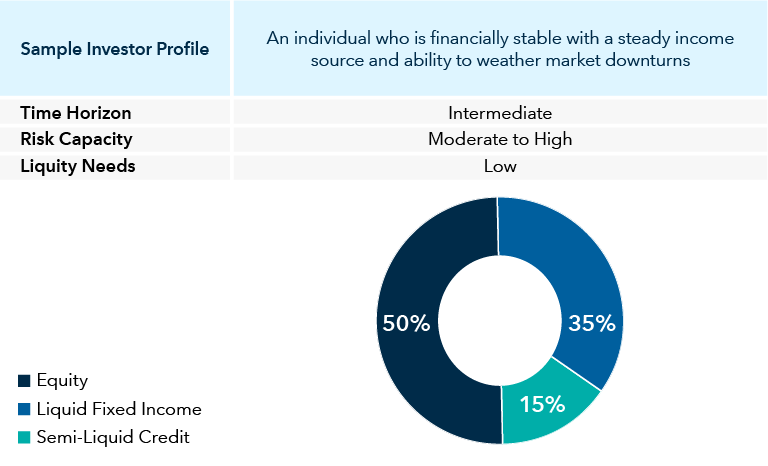
This graphic shows three sample paper portfolios for a more aggressive use case, and how private credit can be included in those portfolios, based on the investor’s time horizon, risk capacity and liquidity needs. For an investor with a long time horizon, moderate to high risk capacity and low to moderate liquidity needs, the sample portfolio includes 80% equity, 15% liquid fixed income and 5% semi-liquid credit. For an investor with an intermediate to long time horizon, a moderate risk capacity and moderate liquidity needs, the sample portfolio includes 65% equity, 25% liquid fixed income and 10% semi-liquid fixed income. For the third sample paper portfolio, for an investor with an intermediate time horizon, moderate to high risk capacity and low liquidity needs, the sample portfolio includes 50% equity, 35% liquid fixed income and 15% semi-liquid fixed income. The source for this information is Capital Group.

For illustrative purposes only

Source: Capital Group

Victoria: So then if we dive into the first set of paper portfolios, here we are aligning it to an aggressive credit strategy. The commonality across these three profiles is a higher tolerance for risk. And then as we get toward an even more conservative profile, which is a 50-50 allocation as the starting point, seeking income is a prioritized portfolio objective. Because you have that need for potentially higher income, we think a strategy that includes private credit could be additive to the portfolio. And overall, where could you be funding it? The natural starting point would be other credit-sensitive strategies in the portfolio. So it likely comes out of your overall fixed income allocation, and then within that fixed income allocation, it comes out of more credit-oriented strategies.


Even a small allocation we think has the potential to change the overall risk/return profile. So, for instance, in the 80-20 portfolio, we allocate a modest 5% to this semi-liquid credit strategy. And the reason for that is, it might seem like 5% is very small. But equity risk dominates that overall portfolio’s risk. And because credit tends to be positively correlated with equities, we think that you may want modest exposure here.


Jan: I think it makes a lot of sense, and I like the idea of using time horizon as a crucial factor, because it really gets at that question of capacity to handle illiquidity. Can you take us through the same process with a more conservative use case?

How can private credit fit in a portfolio?


Sample paper portfolios with more conservative use cases

For illustrative purposes only

Source: Capital Group

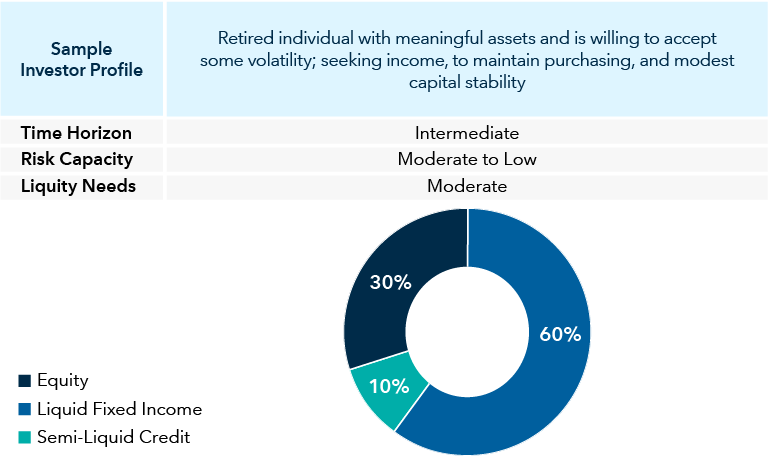
This graphic shows two sample paper portfolios for a more conservative use case, and how private credit can be included in those portfolios, based on the investor’s time horizon, risk capacity and liquidity needs. For an investor with an intermediate to long time horizon, moderate risk capacity and low to moderate liquidity needs, the sample portfolio includes 50% equity, 35% liquid fixed income and 15% semi-liquid credit. For an investor with an intermediate time horizon, a moderate to low risk capacity and moderate liquidity needs, the sample portfolio includes 30% equity, 60% liquid fixed income and 10% semi-liquid fixed income.

For illustrative purposes only

Source: Capital Group

Victoria: Of course. Quite naturally, it should be a lower risk profile for the credit strategy, and that’s what we’re demonstrating here. So we started with the traditional 50-50 portfolio and allocated about 15% from the fixed income exposure to this hypothetical semi-liquid fixed income exposure. The reason for this is, this 50-50, we thought the persona would be a conservative growth and income investor. Because they have that need for income, they want to stay relatively conservative and have a more stable overall total return profile. Similarly, for the 30-70, which is even more conservative, we reduced that allocation to the fixed income strategy that includes private credit. The key here is, especially as you move into the more conservative profiles, we think that it’s really important you need to maintain that low to moderate liquidity need.


Jan: Thanks Victoria. We’ve covered a lot of ground and I hope we have answered a lot of questions. To recap, depending on a client’s specific objectives, time horizon and comfort with illiquidity, private credit can be a valuable addition to a portfolio, offering incremental yield and diversification  — even at modest allocation levels of 5%. Private credit can also help complement traditional public stock and bond holdings by providing access to a broader set of companies and loan structures not typically available in public fixed income markets.


Want to take a more flexible, active approach in your client portfolios?


Get an unbiased point of view on portfolios and talk through solutions with trusted partners. Connect to your Capital Group representative or sign up for an in-depth portfolio analysis and review today.

JNSG

Jan Gundersen is a senior investment director on Capital Group’s Portfolio Solutions & Services team. He has 26 years of investment industry experience (as of 12/31/24). He holds a bachelor’s degree in geology from Colgate University and a masters degree in oceanography from Texas A&M University.

headshot-victoria-quach-600x600

Victoria Quach is a senior client analytics manager with 17 years of industry experience (as of 12/31/24) and has been with Capital Group for seven years. She holds a master’s degree in financial engineering from the UCLA Anderson School of Management and a bachelor’s degree in mathematics and applied science from the University of California, Los Angeles.

For registered investment advisors and institutional investors only.

Capital Group and Kohlberg Kravis Roberts & Co. L.P. (“KKR”) are not affiliated. The two firms maintain an exclusive partnership to deliver public-private investment solutions to investors.


Investments in private credit and related strategies involve significant risks, including limited liquidity and potential loss of capital. These strategies may include exposure to low and unrated credit instruments, structured products, and derivatives, all of which carry heightened credit, market, valuation, and liquidity risks. Investors should consult with their financial professional when considering such strategies for their portfolios.


Source: Bloomberg Index Services Limited. BLOOMBERG® is a trademark and service mark of Bloomberg Finance L.P. and its affiliates (collectively “Bloomberg”). Bloomberg or Bloomberg’s licensors own all proprietary rights in the Bloomberg Indices. Neither Bloomberg nor Bloomberg’s licensors approves or endorses this material, or guarantees the accuracy or completeness of any information herein, or makes any warranty, express or implied, as to the results to be obtained therefrom and, to the maximum extent allowed by law, neither shall have any liability or responsibility for injury or damages arising in connection therewith.


© 2025 Morningstar, Inc. All rights reserved. The information contained herein: (1) is proprietary to Morningstar and/or its content providers; (2) may not be copied or distributed; and (3) is not warranted to be accurate, complete or timely. Neither Morningstar nor its content providers are responsible for any damages or losses arising from this information. Past performance is no guarantee of future results.


Footnote Disclaimer: (1.) Source: Cliffwater Direct Lending Index. All Rights Reserved. Reproduced with permission. (2.) Chart/Graph: Data Source: Cliffwater Direct Lending Index. All Rights Reserved. Reproduced with permission. (3.) Full Disclaimer: “Cliffwater,” “Cliffwater Direct Lending Index,” and “CDLI” are trademarks of Cliffwater LLC. The Cliffwater Direct Lending Indexes (the “Indexes”) and all information on the performance or characteristics thereof (“Index Data”) are owned exclusively by Cliffwater LLC, and are referenced herein under license. Neither Cliffwater nor any of its affiliates sponsor or endorse, or are affiliated with or otherwise connected to, Capital Group Companies, Inc., or any of its products or services. All Index Data is provided for informational purposes only, on an “as available” basis, without any warranty of any kind, whether express or implied. Cliffwater and its affiliates do not accept any liability whatsoever for any errors or omissions in the Indexes or Index Data, or arising from any use of the Indexes or Index Data, and no third party may rely on any Indexes or Index Data referenced in this report. No further distribution of Index Data is permitted without the express written consent of Cliffwater. Any reference to or use of the Index or Index Data is subject to the further notices and disclaimers set forth from time to time on Cliffwater’s website at https://www.cliffwaterdirectlendingindex.com/disclosures.


Source: MSCI. The MSCI information may only be used for your internal use, may not be reproduced or redisseminated in any form and may not be used as a basis for or a component of any financial instruments or products or indices. None of the MSCI information is intended to constitute investment advice or a recommendation to make (or refrain from making) any kind of investment decision and may not be relied on as such. Historical data and analysis should not be taken as an indication or guarantee of any future performance analysis, forecast or prediction. The MSCI information is provided on an “as is” basis and the user of this information assumes the entire risk of any use made of this information. MSCI, each of its affiliates and each other person involved in or related to compiling, computing or creating any MSCI information (collectively, the “MSCI Parties”) expressly disclaims all warranties (including, without limitation, any warranties of originality, accuracy, completeness, timeliness, non-infringement, merchantability and fitness for a particular purpose) with respect to this information. Without limiting any of the foregoing, in no event shall any MSCI Party have any liability for any direct, indirect, special, incidental, punitive, consequential (including, without limitation, lost profits) or any other damages. (www.msci.com)

Investments are not FDIC-insured, nor are they deposits of or guaranteed by a bank or any other entity, so they may lose value.
Investors should carefully consider investment objectives, risks, charges and expenses. This and other important information is contained in the mutual fund prospectuses and summary prospectuses, which can be obtained from a financial professional and should be read carefully before investing.
This material does not constitute legal or tax advice. Investors should consult with their legal or tax advisors.
Statements attributed to an individual represent the opinions of that individual as of the date published and do not necessarily reflect the opinions of Capital Group or its affiliates. This information is intended to highlight issues and should not be considered advice, an endorsement or a recommendation.
All Capital Group trademarks mentioned are owned by The Capital Group Companies, Inc., an affiliated company or fund. All other company and product names mentioned are the property of their respective companies.
Use of this website is intended for U.S. residents only. Use of this website and materials is also subject to approval by your home office.
Capital Client Group, Inc.
This content, developed by Capital Group, home of American Funds, should not be used as a primary basis for investment decisions and is not intended to serve as impartial investment or fiduciary advice.