
June 26, 2025
KEY TAKEAWAYS
- Our high-yield corporate and municipal managers seek to mitigate the effects of pronounced volatility by taking a relative value approach to risk management.
- Within this approach, our high-yield and municipal managers seek to produce risk-adjusted excess returns through a number of active management factors, including idiosyncratic security selection, credit quality, duration and yield curve positioning.
- Over the past five years, our relative value approach to risk management has helped our American High-Income Trust (AHIFX; F-2 share class) and our American High-Income Municipal Bond Fund (AHMFX; F-2 share class) achieve higher absolute and risk-adjusted returns than their Morningstar peers.
- As of March 31, 2025, AHIFX and AHMFX have also ranked in the top 20% of their Morningstar peer groups across the most recent one-, five- and 10-year time periods, as well as since each fund’s inception. And in many cases, the funds have reached the top decile – a remarkable achievement considering the historical volatility of the sectors in which these funds invest.
Like alpine mountaineering, investing in high-yield corporate and municipal bonds can involve a significant degree of risk. While the potential gains may be attractive – a stunning summit or the enhanced returns that higher yielding bonds can produce over time – navigating the high-yield corporate and municipal markets requires disciplined portfolio management to generate consistent excess returns. One way we seek to achieve this objective is to reduce market volatility by focusing on a relative value approach to risk management.
As a general rule – and particularly during market dislocations – high-yield corporate and municipal bonds can be volatile. Accordingly, high-yield corporate and municipal returns can vary widely from year to year depending on a number of factors, including broad market sentiment, prevailing interest rates and the macroeconomic environment. Over the past 20 years, for example, one-year high-yield corporate returns have ranged from 58.76% in 2009 to -25.88% in 2008, while one-year high-yield municipal returns have ranged from 32.74% in 2009 to -27.01% in 2008.
Since 2005, high-yield corporate and municipal returns have been volatile
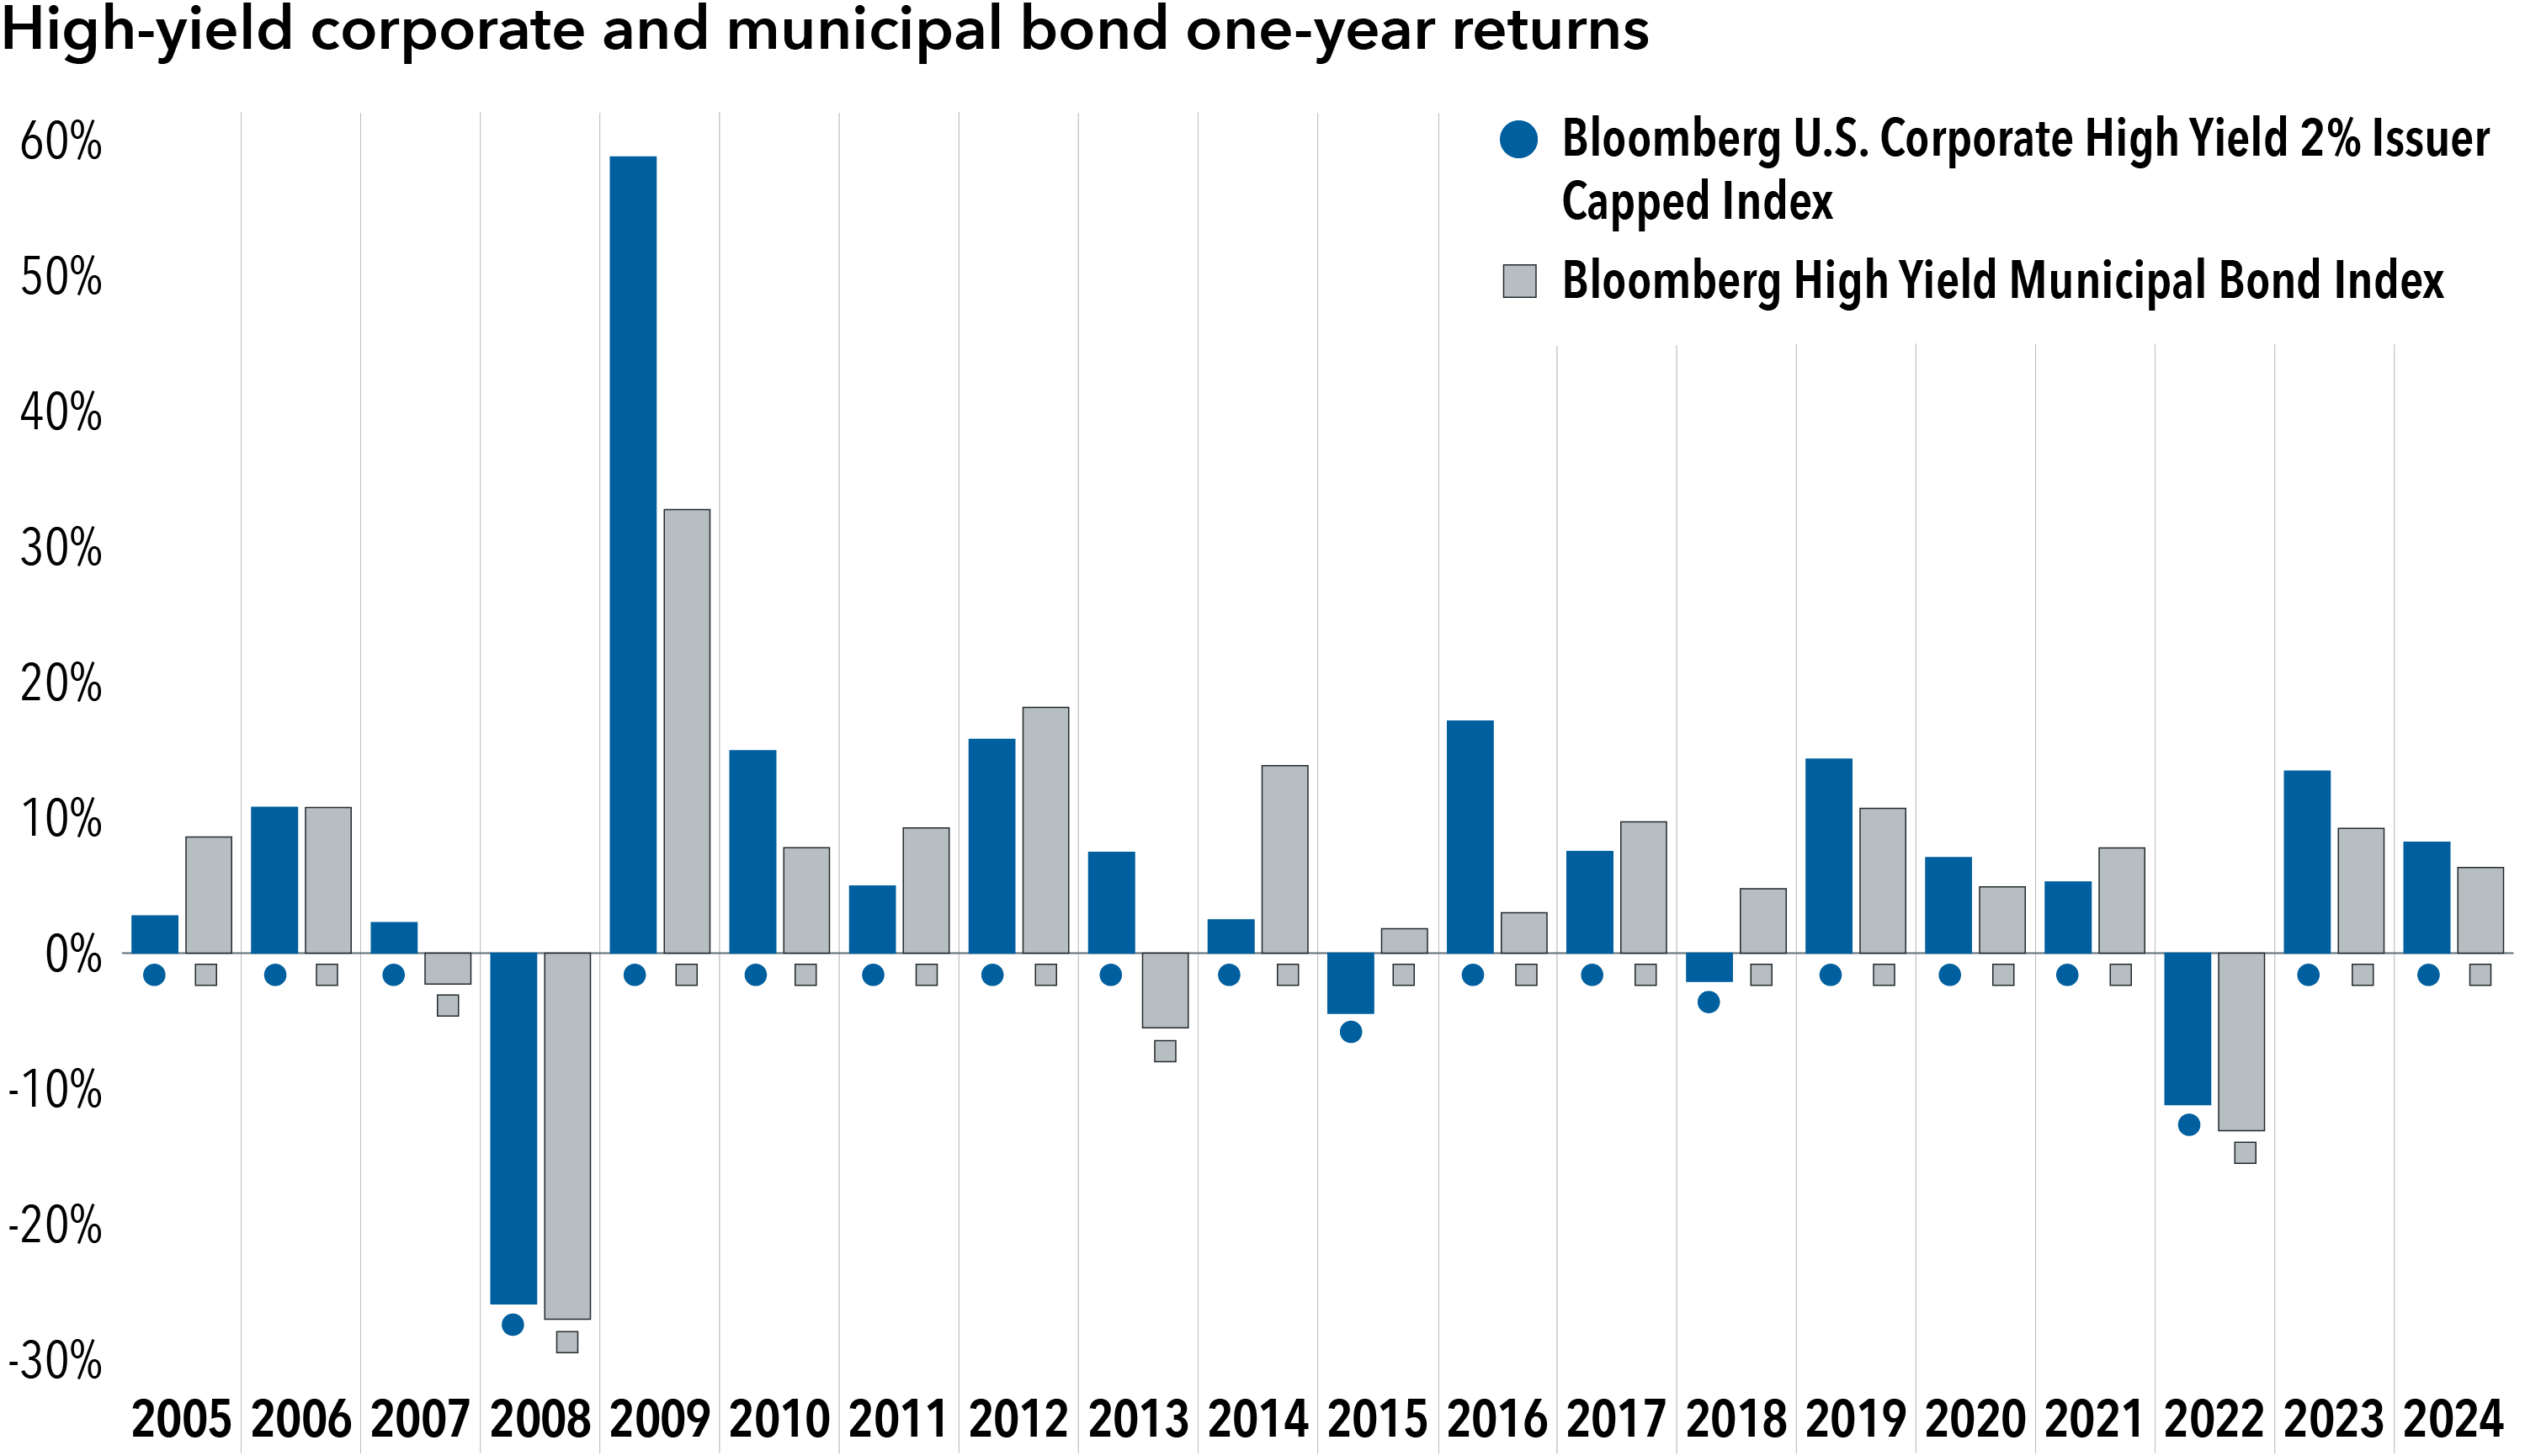
Source: Bloomberg. As of 12/31/24. Returns shown are as of December 31 for each year. Past results are not predictive of results in future periods.
Despite this volatility, over the past 20 years high-yield corporate bonds have averaged an annualized excess return of 364 basis points (bps) over similar-duration Treasuries, while high-yield municipal bonds have averaged an annualized excess return of 163 bps1.
The accordion approach: Managing risk across market cycles
Given this excess return potential, how can high-yield corporate and municipal managers generate consistent excess returns across market cycles? One essential component is to maintain a disciplined portfolio management process throughout periods of intense market stress, including tactical asset allocation decisions at the sector and individual security levels. At the same time, our high-yield corporate and municipal managers seek to mitigate the effects of pronounced volatility by taking a relative value approach to risk management.
Think of an accordion: A skilled musician expands and contracts an accordion to hit important notes and make the flow of a composition smooth and pleasing to the audience. By the same token, our high-yield corporate and municipal managers expand and contract their risk exposure in different market environments to mitigate volatility and seek consistent excess returns.
In markets where we believe high-yield corporates and/or municipals are overvalued, our managers will contract their risk exposure and increase their allocations to higher quality issues. Conversely, in markets where we think high-yield corporates and/or municipals are undervalued, our managers will expand their risk exposure and emphasize lower quality issues.
For example, since the end of the COVID-19 pandemic, the American High-Income Municipal Bond Fund (AHMFX; F-2 share class) has materially decreased its exposure to the tobacco sector. While the sector remains a large part of the municipal market, our portfolio managers believe that it’s been largely overvalued and that it relies on poor credit fundamentals – namely, the long-term decline in smoking among U.S. consumers.
At the same time, AHMFX has increased its risk exposure to certain tax allocation bonds. These particular credits, which help fund redevelopment projects and pay investors back through pledged higher taxes on reassessed real estate values, are primarily supported by new construction activity in the Denver and Colorado Springs areas. Despite high mortgage rates, development in these areas continues to move forward. The AHMFX team favors the high levels of spread and yield compensation that these tax allocation bonds offer, as well as the fact that their payment structures don’t depend on near-term construction activity. Instead, they rely on a more moderate pace of development that aligns with our long-term outlook for buildout in these regions. Taken together, our portfolio managers believe that these allocation changes have provided AHMFX with a more beneficial risk/reward profile.
Research is part of our DNA
Within our relative value approach to risk management, our high-yield and municipal managers seek to produce risk-adjusted excess returns through a number of active management factors, including idiosyncratic security selection, credit quality, duration and yield curve positioning. Of course, idiosyncratic security selection depends on deep fundamental analysis, a discipline that we consider part of our DNA: understanding a bond issuer, its cash flows, and the probability that it will be able to make its debt payments on time. In addition, effective security selection depends on accurately assessing bond indentures, credit agreements (including the use of collateral) and lien structures so that we can potentially limit capital losses in the event of default.
Our taxable and tax-exempt high-yield teams think of the high-yield sector as one that involves asymmetric risks. In the best-case scenario, a high-yield issuer will pay its bond investors 100 cents on the dollar plus an attractive interest rate. But in the worst-case scenario, a high-yield issuer may default partially or completely, leaving bondholders with sharp capital losses. Or to return to the mountaineering analogy: In the best case, a climber scales a difficult peak and reaches a world-class summit; in the worst case, falls can be costly. As such, utilizing deep fundamental research to minimize capital losses becomes an extremely important part of achieving consistent returns in higher yielding bond investing.
In-depth research yields critical insights
Our investment-grade (BBB/Baa and above) and high-yield (BB/Ba and below) research teams collaborate on hundreds of calls and site visits per year with bond issuers like hospitals and utilities companies. This collaboration – and the working relationships that our research teams develop along the way – help us to assess the issuers’ operational and financial health, which in turn helps us determine the relative value of their bonds.
For example, over the past few years, our investment-grade, high-yield and equity research teams have met with the senior management teams of several California utilities and have done extensive analysis of these companies’ financial metrics. The depth of this research became invaluable when we evaluated these issuers in the aftermath of the wildfires that devastated parts of Los Angeles early this year. In the wake of the damage, some bond investors simply wanted out of California utilities, apparently regardless of the actual risks within the financial equation. Fortunately, our fundamental analysis and our understanding of 2019 legislation that limited the amount of liability that California utilities would incur helped us to assess the value of these issuers’ bonds from a more rational standpoint.
Contrary to market consensus, our analysts concluded that California utilities were generally well-equipped to handle even the worst liability claims that might arise from the wildfires. On that basis, when fearful investors began selling these bonds at significant discounts to our view of fair value, we were generally buying, with high conviction that the intrinsic value of these bonds would eventually be reflected in their prices. Ultimately, we believe that these investments will yield attractive upside for our investors.
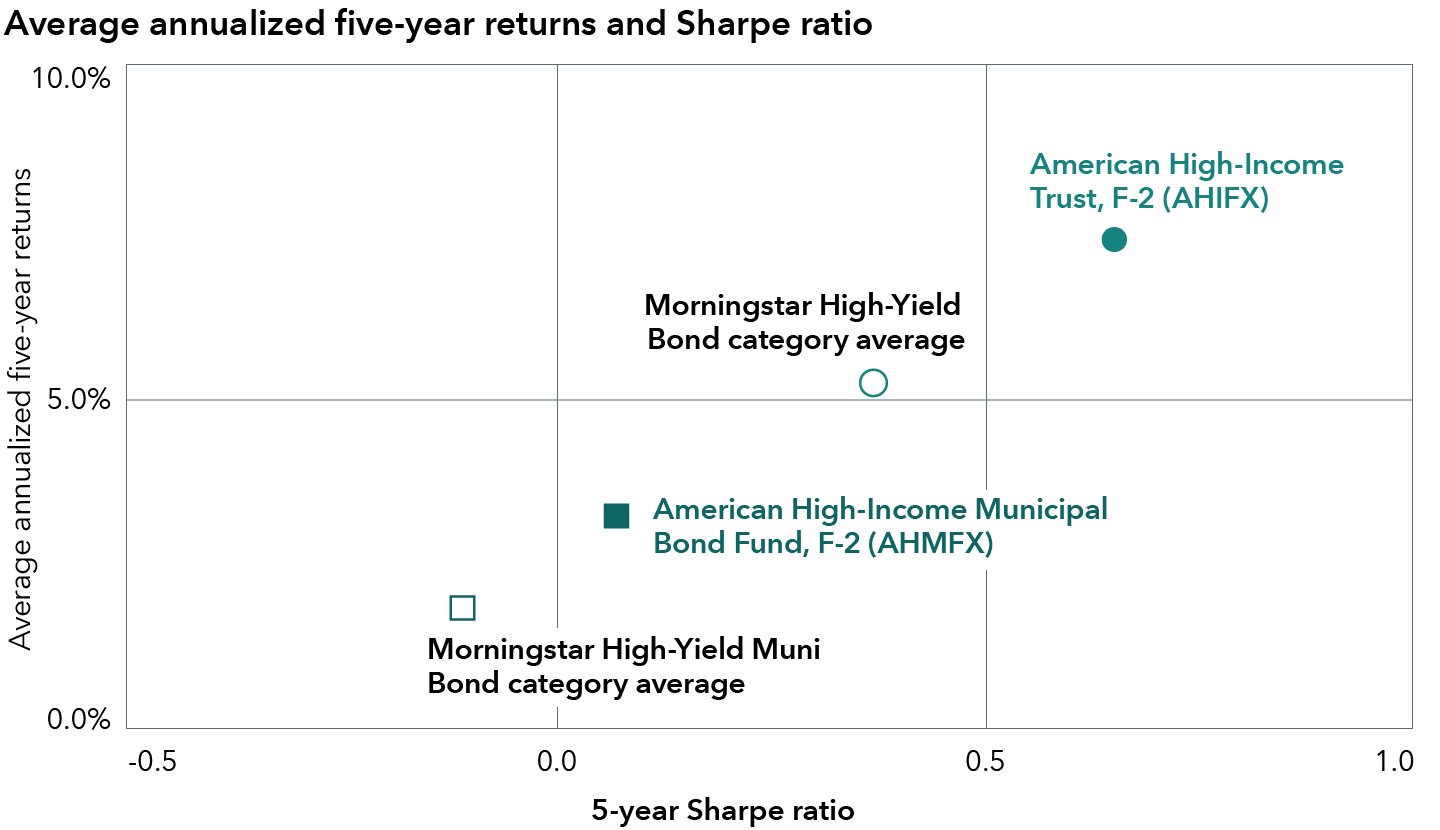
Producing higher absolute and risk-adjusted returns
Over the past five years, our relative value approach to risk management has helped our American High-Income Trust (AHIFX; F-2 share class) and our American High-Income Municipal Bond Fund achieve higher absolute and risk-adjusted returns than their Morningstar peers.
1 Source: Bloomberg. As of 4/30/25. Based on the 20-year return of the Bloomberg 3-7-Year U.S. Treasury Index versus the returns of the Bloomberg U.S. Corporate High Yield 2% Issuer Capped Index and the Bloomberg High Yield Municipal Bond Index, respectively.
AHIFX and AHMFX have outpaced their peer groups
Sources: Capital Group, Morningstar. Data as of 5/31/25.
As of March 31, 2025, AHIFX and AHMFX have also ranked in the top 20% of their Morningstar peer groups across the most recent one-, five- and 10-year time periods, as well as since each fund’s inception. And in many cases, the funds have reached the top decile – a remarkable achievement considering the historical volatility of the sectors in which these funds invest.
A long-term record of pursuing consistency
Morningstar percentile rankings
(based on total return) (updated monthly)
Source: The category for American High-Income Trust is High Yield Bond; the category for American High-Income Municipal Bond is High Yield Muni. When applicable, results reflect fee waivers and/or expense reimbursements, without which they would have been lower. Please see capitalgroup.com for more information. Past results are no guarantee of results in future periods.
Additionally, both AHIFX and AHMFX have achieved “Total Return Within Category” ratings of 5 (the highest rating) from Lipper over three, five, and 10 years as of May 31, 2025. For AHIFX, the total number of investment companies in the Lipper category over three, five and 10 years is 460, 419 and 318, respectively. For AHMFX, the total number of investment companies in the Lipper category over three, five and 10 years is 179, 173 and 114, respectively. Total return data are updated monthly.
The Capital System: multiple managers and highly experienced teams
Both AHIFX and AHMFX benefit from The Capital System™, in which each fund at Capital Group is managed by multiple portfolio managers and analysts. This distinctive investment approach is designed to deliver superior long-term investment results across asset classes. In our view, allowing a team of professionals to invest in their highest-conviction ideas creates an environment in which each manager or analyst can express his or her views within the portfolio, ideally resulting in a balance of views within the fund as a whole. In addition, both AHIFX and AHMFX maintain highly experienced portfolio management teams, with an average of 28 years of investment industry experience for AHIFX and 26 years for AHMFX as of March 31, 2025.
In contrast to many asset management firms, we also empower analysts to manage portfolio assets as part of The Capital System. We believe this is a competitive differentiator, and one that has strongly contributed to the success of AHIFX and AHMFX since their inception. Our skilled traders also contribute significantly to the success of our high-yield and municipal funds. Their in-depth market knowledge, well-developed counterparty relationships and rapid execution help our portfolio managers and analysts implement their investment ideas with speed, liquidity and minimal trading friction.
Team focus and deep experience help produce consistency

Source: Capital Group. As of 12/31/24.
From a broad perspective, AHIFX and AHMFX seek consistency of returns as a goal in itself. While both portfolios are flexible enough to allow for opportunistic investing, the consistency of their returns is ultimately a product of careful fundamental analysis, disciplined risk management and the deep experience of our high-yield and municipal teams.

David Daigle is a fixed income portfolio manager with 30 years of investment industry experience (as of 12/31/2024). He serves as the principal investment officer of American High-Income Trust®. He holds an MBA from the University of Chicago and a bachelor’s degree in business administration from the University of Vermont.
Chad Rach is a fixed income portfolio manager with 32 years of investment industry experience (as of 12/31/2024). He holds an MBA from the University of Chicago and a bachelor's from Marquette University.